| How To Adjust Trendlines |
| By Andy Swan |
Published
06/29/2007
|
Currency , Futures , Options , Stocks
|
Unrated
|
|
|
|
How To Adjust Trendlines
Sometimes a trendline needs to be adjusted. This can be a need in all styles of trading. In the case of a steep line, as prices break the line, a slower trendline needs to be drawn. In the case of a flat trendline, a new line must be drawn at a steeper angle as the prices climb.

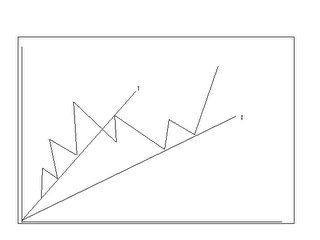
Above is an example where the original trendline (line 1) proved to be too steep. So as the prices broke downward into a slower and more substantial level, a new trendline was drawn (line 2).

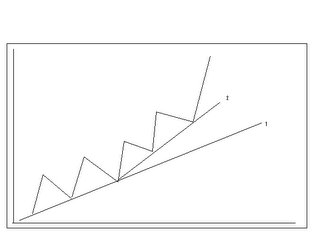
The graph above shows an up trendline (line1) that was too flat once the prices accelerated in the uptrend. Line 2 is drawn to adjust the trendline to follow the accelerated rise in prices.
Often in the case of an accelerating trend, several trendlines are drawn at increasingly steeper angles, and the steepest line becomes the most important. A trader needs to re-evaluate the situation to see if he's using the best tool. Perhaps a more appropriate tool would be - the moving average - which is the same as the curvilinear trendline. All these tools work. It's just that some work better in certain situations, and then aren't as useful in other situations. In the case of an accelerated trend, a moving average would be a better tool than a series of trendlines.

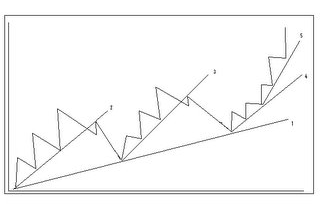
There are differing degrees of trend, and different trendlines can help define those degrees. Note in the above graph, line 1 defines the entire movement as a major uptrend. Lines 2, 3 and 4 show intermediate uptrends, which are shorter secondary swings. Finally, line 5 defines a shorter advance within the last intermediate uptrend movement.
Andy Swan is co-founder and head trader for DaytradeTeam.com. To get all of Andy's day trading, swing trading, and options trading alerts in real time, subscribe to a one-week, all-inclusive trial membership to DaytradeTeam by clicking here.
|