|
Is the Stock Market Bullish?
The bullishness has been persistent lately, almost to the point of being hard to believe. So, do we actually believe it will continue, or not? We're not going to be able to answer the question just yet, though we will say we tend to side with momentum most of them time - until we have a reason not to.
Momentum
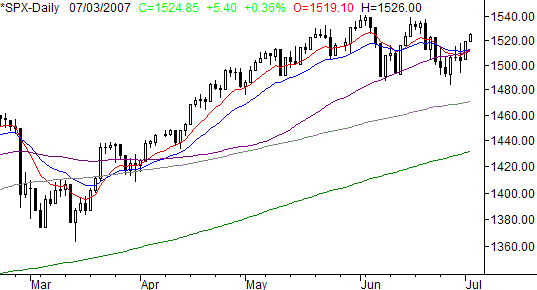
It may not be a very esoteric or complicated notion, but the market is clearly going higher more often than not. Heard the phrase 'The trend us your friend'? Though the complete term is 'The trend is your friend - until it isn't', right now, the trend is to the upside, even if it's choppy. I don't think there's a much better indication of this than the S&P 500's chart.
What makes the current momentum so compelling is that it may have been renewed with the recent volatility. From March through May, the SPX's ascension was unquestioned. However, it's hard to keep buying after such a strong run (and most people didn't). However, with all of that pressure bled off by the market's pause, jumping in now is less nerve-racking. Now the 50 day line (purple) has had time to catch up, and - so far - it's been playing a support role. A few days ago it looked like the 10 and 20 day lines would pull under it. But last week, the SPX crossed back above all three of them again. It looks a lot like March's chart.
S&P 500, with 10-, 20-, 50-, and 200-day lines - Daily

The line in the sand here is the horizontal red line at 1490. We've toyed with that level recently, but haven't broken it yet. If we do, it will be a lower low, and perhaps the beginning of the end. For now though, the SPX is pointed in the other direction. A move past the recent highs of 1540 could really spark some bullishness.
Short-Term TRIN
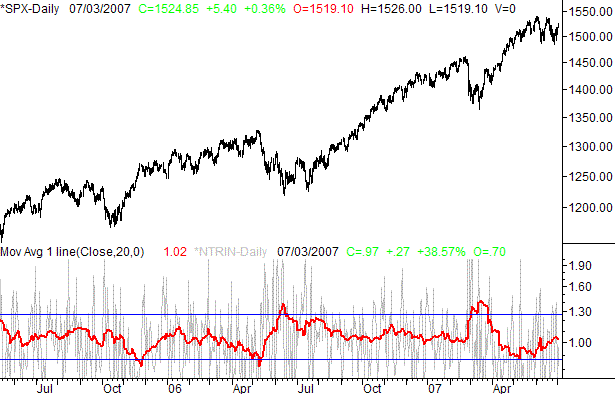
In any case, the NYSE TRIN reading's 20 day moving average (the way we make sense of otherwise erratic data) says not to worry too much. The vulnerability came in early May, when the 20 day average of the NYSE TRIN (red) fell to under 90. IN general, by the time we've hit that point in the past, we were at least slowing down on a bullish trend, or preparing for an outright pullback....a big one. This time, though, the low reading seems to have been burned off with just the gyration over the last couple of weeks. Back around 1.0, the 20 day TRIN average is just, well, just average. (Note that the timeframe here makes all the difference, as we'll see tomorrow.)
S&P 500 with NYSE TRIN's 20-day moving average - Daily

New Highs (NASDAQ)
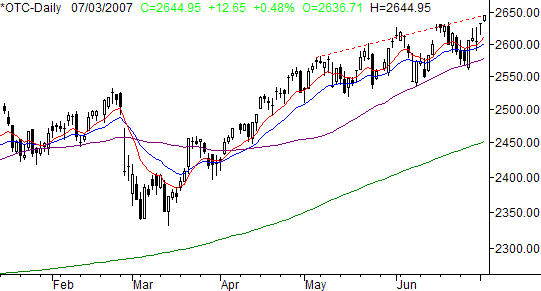
Nothing speaks louder than results. Though the Dow and the S&P 500 haven't yet this month, the NASDAQ Composite has once again hit new multi-year highs. Now, bear in mind the NASDAQ has not done a good job of making strings of 'new high' days lately, instead plunging only a few points into new high territory before a small pullback. See the dashed red line on the chart below. It's two steps forward and one step back, but the net effect is still a positive one. The point being, dips have been good buying opportunities in recent days.
NASDAQ Composite with 10-, 20-, 50-, and 200-day lines - Daily

What we're looking for is a sign that the pattern has stopped. What will that be? A lower low, or perhaps more evidently, a close or two under the 50 day line.
VIX (short-term)
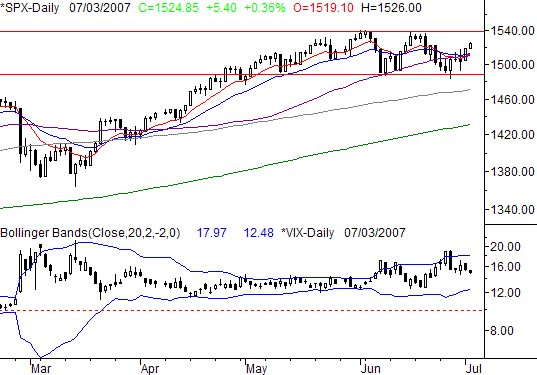
We thought the VIX's rise a couple of weeks ago might be a bearish problem, but at this point, the VIX is falling - which is bullish for stocks. More than that, it has more room to fall until the lower Bollinger band is met. Therefore, stocks have more room to rise. The catch here is that it's not like the VIX is miles way from its lower band line. So, it won't take too very long (probably) for it to hot that lower ban. In the meantime, stocks may get at least a short-term boost.
S&P 500 with VIX - Daily

The Last Word
Just a few things to think about - we'll be looking at all of them. However, it's equally important to understand the counter-arguments. So, be sure to check in tomorrow. I suspect either way we'll break out of this rut and start to move soon. Obviously being on the right side of such a move is a big deal.
Price Headley is the founder and chief analyst of BigTrends.com.
|