| Is the Stock Market Bearish? |
| By Price Headley |
Published
07/7/2007
|
Stocks
|
Unrated
|
|
|
|
Is the Stock Market Bearish?
Long-Term TRIN
In the companion "bullish" article, we mentioned that the intermediate-term NYSE TRIN level was nominal. The 20-day average of 1.02 was about as moderate as we can imagine, so there wasn't likely to be any oddball breadth of depth re-balancing pressures in the near-term. However, we can't exactly say breadth and depth are well balanced in terms of a 'bigger picture' view.
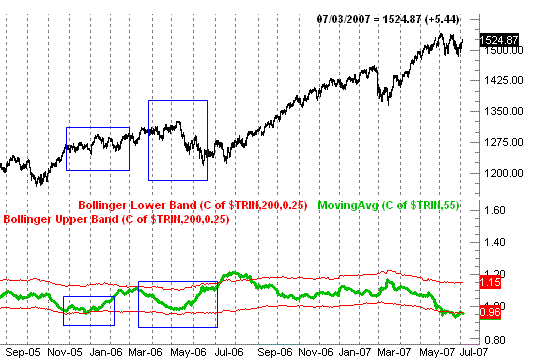
We've been using the 55-day moving average of the NYSE's TRIN reading to get a bead on how far the market can reasonably go before reversal pressures start to kick in. Well, according to the chart, we may be at that point. In late June, the 55-day average of the TRIN level feel to 0.93, which was the lowest we'd seen it fall since October of 2000, when thing really started to unravel for the market (yet nobody really had any inkling of just how bad things would be getting). Scary stuff.
Now, to be fair, this isn't a sure-fire sign, and it certainly doesn't pin-point the exact top if there's going to be one made. However, far more often than not, a TRIN reading this low is associated with at least a slow-down in the market's upward progress, if not a pre-cursor to an outright correction. See the lull from December of 2005 and last May's violent dip. Both were started in a low-TRIN average environment.
S&P 500 with 55-day moving average of NYSE TRIN - Daily

% Above 200-Day Line
We've looked at this a few times before, but in case there's anybody new, the premise is pretty simple. While we use overbought/oversold indicators (like stochastics and RSI), we think there may also be a different set if advantages by looking at something a little more relative. Measuring how far away (above or below) an index is diverged from a long-term moving average may also tell you when it's likely to return to its mean. In other words, the index can only get so far away from moderate levels before it has to close the gap.
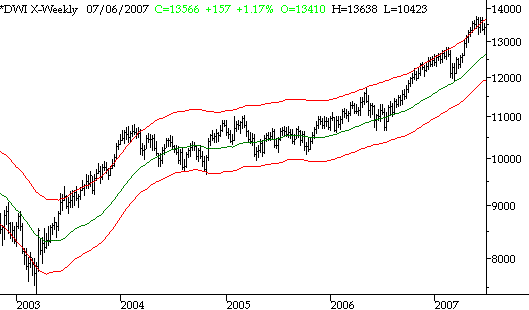
Though there's no hard and fast rule about how far is too far, we've used something near 7% as our rule of thumb....at least for the Dow Jones Industrial Average. (Follow-up research has shown that each index has its own unique 'too far' limit, and even the bullish 'too far' and bearish 'too far' levels aren't always the same number.) And as you can see on the Dow's chart below, an 7% bullish deviation is about right.
The two red lines are 7% above or 4% below the Dow's 200 day moving average line (in green). Though the settings are not ideal for a bearish environment, they've pretty much caught most of the peaks during this recent bull market. More importantly, you don't need us to tell you the Dow ran up into the upper limit line a few weeks ago, and has indeed struggled since then. Though the end result is ever the same twice, we have observed most encounters with the upper limit are best abated by a pullback all the way to the 200 day moving average line. If we don't do it now, we'll just have to later.
Dow Jones Industrial Average, with 7% ceiling/4% floor - Weekly

On the flipside, the NASDAQ and the S&P 500 have a different set of 'too far' limits. We'll look at this in detail when the time comes.
Calendar
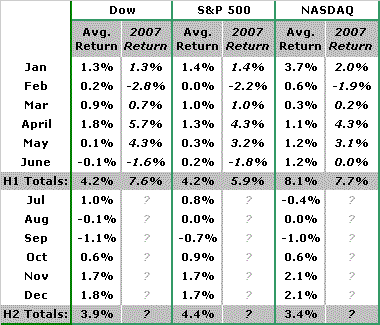
While it can be dangerous to assume stocks trend solely according to the calendar, it would also be dangerous to ignore the long-term averages. In that light, the time of year may be working against the bulls and for the bears. In fact, the unusual strength we saw during the first half of 2007 may be exaggeration the bearish pressures to correct the unchecked run-up and bring the market back to its typical readings.
Take a look at the results for all the major indices for the first six months of the year -- the averages, and this year's actual figures. It's been a fun ride for the bulls, but nothing really out of the ordinary. Likewise, a pullback in the near-term wouldn't be out of the ordinary - Q3 is usually tough. It will be interesting to see if the market bucks the trend for the year, or finally gives in.
Average Returns By Month, By Index

Bottom Line
Just some things to think about as we close out the week. Like we said, neither argument is all that solid yet, but we'll let you know when things start to materialize with these key factors.
Price Headley is the founder and chief analyst of BigTrends.com.
|