| Weekly Outlook in the Stock Market |
| By Price Headley |
Published
07/8/2007
|
Stocks
|
Unrated
|
|
|
|
Weekly Outlook in the Stock Market
NASDAQ Composite Commentary
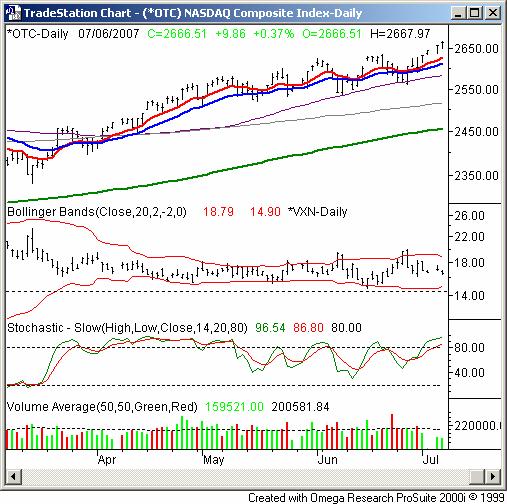
On Friday, the NASDAQ Composite gained 9.86 points (+0.37%) to end the day at 2666.51. For the week, the index gained 63.28 points (+2.43%). It was also a new multi-year high made in an impressive fashion. Though we can't say the same for the other indices, these gains may be more than the NASDAQ can support.
After hitting the 50-day moving average line (purple) in late June, the NASDAQ has been on a roll - up 4.1% from the June 27 low of 2560.45. It was the strongest week and a half we've seen in a long time, but was it too good? We're now stochastically overbought. The last two times we were (06/05 and 06/21), the NASDAQ Composite pulled all the way back to the 50-day line.
The counter-argument is that we stayed stochastically overbought between mid-March and early May - stocks rallied the whole time.
Those same folks might also argue the CBOE NASDAQ Volatility Index (VXN) looks to be moving lower more than it does higher, with plenty of room to keep falling.
Specifically for the NASDAQ, we'd be leery of jumping in now. If this bullishness is for real, there will still undoubtedly be pullbacks to use as entry spots. And/or, those same pullbacks will serve as confirmation that this unusual bullishness will persist. The key is what happens at the 20-day line at 2612, and then what happens at the 50-day moving average line. Both have been support so far, but things change.
Just for the record, the volume behind Thursday and Friday's buying was weak.
NASDAQ Composite Chart

S&P 500 Commentary
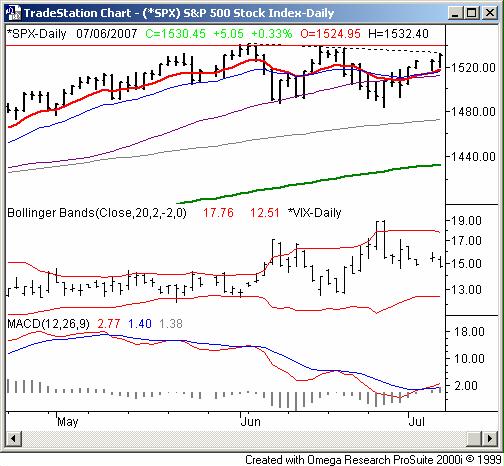
The S&P 500's close of 1530.45 Friday was a 5.05 point (+0.33%) improvement. For the week, that meant a 27.10 point (+1.8%) gain, and a 're-load' on bullish momentum. Can it last? We've seen it happen before under the same scenario.
During the last two weeks, the S&P 500 has crossed back above its 10-, 20-, and 50-day lines, all of which are basically in the same place. You may also remember we were recently thinking the 10- and 20-day lines (red and blue) cross under the 50-day average (purple) could be a bearish problem. Well, since then, the problem has been staved off. Technically, the 10- and 20-day lines are bullishly diverging from the 50-day line again. We've also got a new MACD crossover. On top of that, the VIX is sinking, and has more room to move even lower. In other words - at face value - the scenario seems to be a bullish one.
However, in our quest to find optimal entry points into such potential uptrends, we do think there are two hurdles traders could use as milestones. The first one is the resistance line (dashed) that halted Friday's advance. It extends back to the SPX's early-June peak, and also tags the mid-June peak. The second one is the potential ceiling at 1540 (red horizontal line)....the new all-time highs hit in early June. The passing of those two hurdles will make further upside progress even easier.
On the flipside, the combined 10-, 20- and 50-day averages make for a meaningful support line. The lowest of those three is at 1512, and rising. If that level breaks as support, then caution is merited (though we're not going to call it an omen of bearish things to come - see late June for why).
S&P 500 Chart

Dow Jones Industrials Commentary
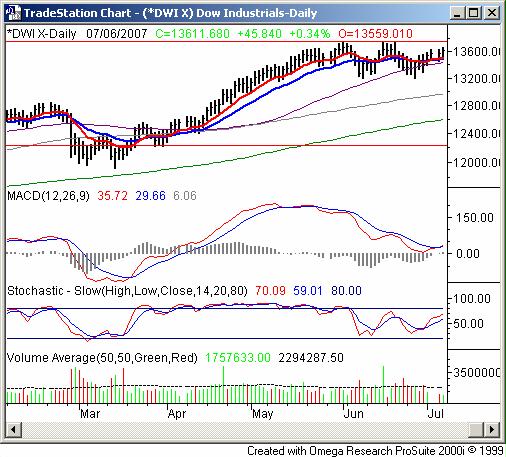
The Dow Jones Industrial Average ended at 13611.68 last week, up 45.84 points (+0.34%) for the day, and up 203.06 points (+1.51%) from the previous week's close. Like the SPX, it appears the bullish momentum has been restored, doesn't it?
There are a lot of similarities between the Dow an the S&P 500 right now. The one we're most interested in, however, is the new upward momentum we seem to be seeing on the 10- and 20-day moving average lines (red and blue). Two weeks ago they were pointed lower; now they're not.
We also have a new MACD crossover, and unlike the NASDAQ, we're NOT stochastically overbought here. So, if the momentum gets traction, we don't see any immediate roadblocks.
We do however see a roadblock down the road: 13,756. That was the all-time high made on June 1. It was close to retested in mid-June, and the pullback then leaves us wondering if there's a ceiling there. If there is, any upward move from here may not last too long. Notice how we'd be stochastically overbought by that point in time. If we can clear that hurdle though, look out above.
The bearish make-or -break point remains the 50-day line (purple).
Red Flag: The volume behind last week's buying was also very thin here, and does not necessarily express the majority opinion.
Dow Jones Industrials Chart

Price Headley is the founder and chief analyst of BigTrends.com.
|