| Which Stock Sectors Are Moving? |
| By Price Headley |
Published
07/10/2007
|
Stocks
|
Unrated
|
|
|
|
Which Stock Sectors Are Moving?
With last week's rising tide lifting all boats and Tuesday washing them all out again, we'll take the time to catch up on some of our recent sector analysis, and make any adjustments as necessary.
Hot Water
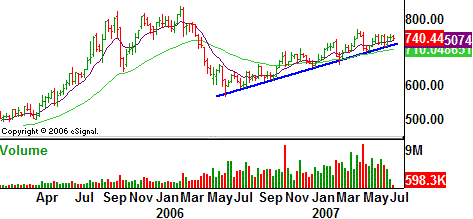
We've been bullish on water stocks since February, and really since last year. Moreover, based on the current chart of the Dow Jones Water Index, we're going to remain bullish. The index is still riding the gentle bullish slope of its 50-day moving average, and we think the industry's dynamics here (huge infrastructure demand, shrinking supply of clean drinking water, etc.) are just now coming to light. The more they do, the more we feel this segment could move.
We didn't have one the last time we looked on May 30, but let's go ahead and set a stop on the bullish bias at 723, where that support line is resting. As for a target, let's use the 2006 peak of 838 for the time being.
Dow Jones Water Index - Weekly

Insurers at a Crossroads
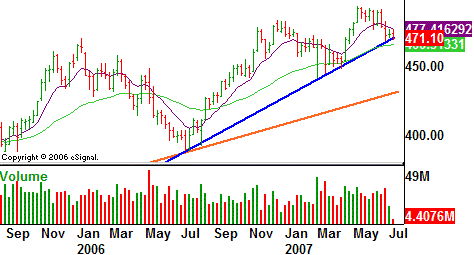
When we last looked at the Dow Jones Full Line Insurance Index (also on May 30), we were bearish based on the cross under the 20-day moving average, and the fact that it was so overbought. Since then the index has obliged, as it fell from 484.4 to 471.2.
At the time, we established a target at 459, where the 200 day average line was. Since then, it's moved. That's ok though, since we want to rethink the chart anyway.
As of right now, we see two potential support lines. The short-term one is blue, and as you can tell, we're testing it at this very moment. If it fails (and we expect it to), the next one is the long-term one at 431 (orange). We've taken the 200-day line out of the equation for the time being.
Either way, let's set a stop on this bearish bias at 477, where the 50-day line has held up as resistance for the last two weeks.
Dow Jones Full Line Insurance Index - Weekly

REITS Get Rocked
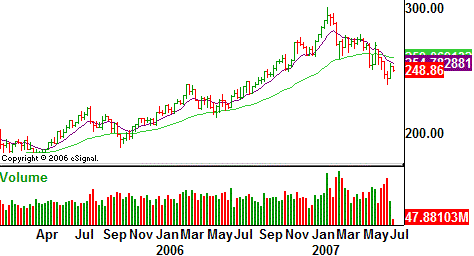
We first suggested REITs were in trouble on May 2, when the Dow Jones REIT Index (RCI) was trading at 266.8, but possibly headed into a head-and-shoulders pattern. Though it waffled a bit between then and now, it's currently trading at 248.8, and still pointed lower.
The thing is, the worst may not be over yet. For the first time in years, the 50-day line is under the 200-day line, and there's not even a hint of relief with years worth of gains that could be burned off.
Though there's still some moderate rebound risk, we're going to set a target of 213 for this chart where the bottom was made in mid 2006. Let's set a stop on this bearish bias at 254, where the 50-day line currently is.
Dow Jones REIT Index - Weekly

Over and Done
You might recall we were also tentatively bearish on the Dow Utilities Index on May 30, as it had fallen under its 50-day line. At the time the index was 514.8, so the move to a low of 485 basically meant the directional call was correct, though not as deep as we expected. Since then, the index has made its way back up to 506. With that, we're going retract our pseudo-bearish call here. Hopefully you got out before the rebound back up to 506, but if not, you're still better than break-even.
Price Headley is the founder and chief analyst of BigTrends.com.
|