| Using Speedlines in Your Trading |
| By Andy Swan |
Published
07/13/2007
|
Currency , Futures , Options , Stocks
|
Unrated
|
|
|
|
Using Speedlines in Your Trading
Using speedlines is a technique that combines trendlines and percentage retracements. Edmond Gould developed this technique which is an adaptation of dividing the trend into thirds. Speed resistance lines measure the speed, rate of ascent or descent, of a trend. This method can be used in any type of trading.
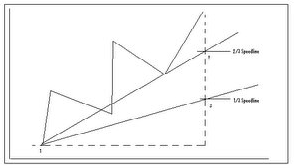
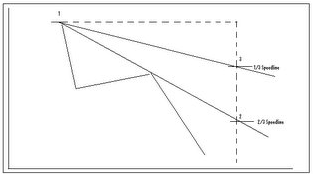
Let's set up a bullish speedline in an uptrend. Look at the two graphs below. In the uptrend, we have drawn a vertical line down from the highest point of the trend to where the trend began. Then we divided it into thirds. Next, two trendlines are drawn from where the trend started at point 1 through the thirds set on the vertical line at points 2 and 3. In the second graph, a downtrend, we have drawn a vertical line from the lowest point up to where the trend began (point 1), divided it into thirds, and drawn two trendlines through the two points at 2 and 3.
Uptrend with Speedlines

Downtrend with Speedlines

A new set of lines must be drawn after each new high in an uptrend or low in a downtrend is reached. Often speedlines move through the price action because they are drawn from the beginning of the trend to the two points on the line marking thirds. So this is one time when trendlines are not drawn over or under highs and lows but through them.
Looking back at the uptrend graph, if the trend is correcting itself, the downside of the correction will most likely stop at the two-thirds speedline. If not, they may drop down to the one-third speedline. Any lower drop beyond one-third could mean prices would fall back to the beginning of the prior trend. In a downtrend, breaking the lower line signals a rally to the higher or one-third speedline. If point 3, the highest line, is broken prices will probably rally to the top of the prior trend.
Just like trendlines, speedlines reverse roles once they're broken. So during the correction of an uptrend, if the two-thirds line, the upper line, is broken and prices fall to the one-third line and rally from there, the upper line then becomes a resistance barrier. Only when the upper line is broken would a trader expect the old highs to be challenged. The same principle is true for downtrends.
Andy Swan is co-founder and head trader for DaytradeTeam.com. To get all of Andy's day trading, swing trading, and options trading alerts in real time, subscribe to a one-week, all-inclusive trial membership to DaytradeTeam by clicking here.
|