|
Weekly Outlook in the Stock Market
NASDAQ Composite Commentary
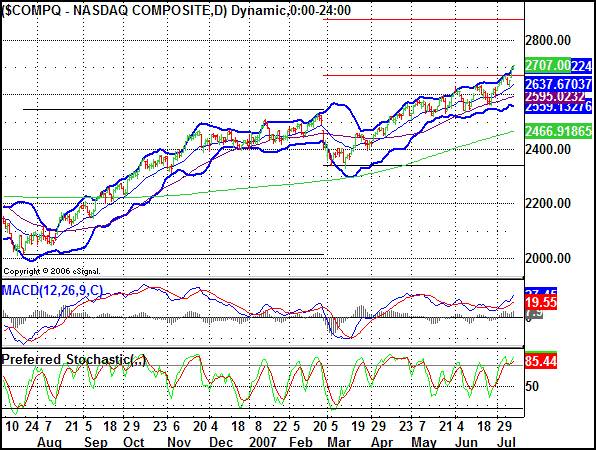
On Friday, the NASDAQ Composite gained 5.27 points (+0.2%) to end the day at 2707.0 -- a new multi-year high. For the week, that meant a 40.49 point gain, up 1.52% from the previous Friday's closing level.
This is interesting set of chart we have this week. Most oscillators said the NASDAQ was so overbought, the natural course of action would be a downward move. Yet momentum is momentum, which we have to side with until it's clear we can't anymore.
Needless to say, the momentum is still with the bulls. We have a renewed MACD crossover, and the attack on the upper Bollinger band has been reinstated. And that upper band is going to be the bulk of our discussion today.
Regular readers will recall there are two general ways to interpret the Bollinger bands. One is to assume reversals will happen there. The other is to assume once the index has reached that point, it has enough momentum to keep pushing them in that direction. The latter has been the accurate interpretation recently, particularly between August and November of last year, but also from March to now.
So, as we bump up into the upper band, we're not immediately expecting a major pullback. We do, however, at least expect a slight easing for a few days (that has been the pattern of late). The 20-day line (the thin blue one) at 2638 appears to be the regrouping point.
And now that the incredible has happened, where might this momentum take us? Let's break out the Fibonacci numbers again -- the only horizontal lines you'll see on the chart. Using last July's low, February's peak and March's bottom as a frame of reference, you can see the 61.8% extension line at 2671 has already been broken. The next line is the 100% extension at 2874. Seems crazy that the NASDAQ could really move that far, doesn't it? However, it did it last year, and it seemed just as crazy then.
On the bearish side of the equation, the 50-day line (purple) at 2595 is still the line in the sand. A move under it could present a new set of problems, especially considering how overbought we are. If it happens, we're going to take it at face value.
NASDAQ Composite Chart

S&P 500 Commentary
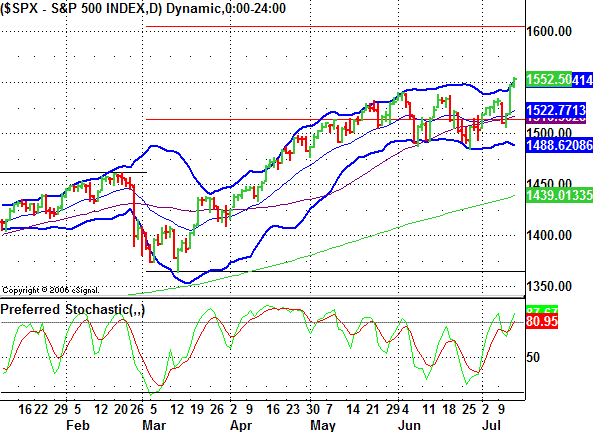
The S&P 500's close at 1552.50 Friday was the result of a 0.31% (+4.8 point) gain. Like all the indices, it hit new 52-week highs. On a weekly basis, the SPX was up 22.06 points, or 1.44%.
Note that the S&P 500 hit new all-time highs last week, but for all intents and purposes, has basically stalled at that 1550/1555 area. The previous official high was 1552.87, and we hit 1555.10 last week before coming back to 1552. We'll call it even.
We have to wonder if this is going to be the sell point for most traders and investors. We know so far it hasn't been, but the market has a way of making it appear as if everything is going to be ok, and then up-ends the entire thing. Not that the market is in itself an entity, but collectively, it can behave as one. In other words, this could be a trap of sorts.
As part of the trap, perhaps the SPX could lure even more traders in by actually getting a little bit into new all-time high territory before blowing up. Using the same Fibonacci line analysis as above, the 100% extension level (the red horizontal line along the top of the chart) lies at 1605. That's plenty to make it seem safe for everyone to 'buy new highs', and it's also a natural profit-taking level. No matter what we do next, we suspect 1605 may be a nice exit point for longs, and an entry point for shorts.
On the flipside, if we never get there, we still feel we're due for a substantial pullback - probably towards the 200-day line currently at 1439 (though it moves higher every day). We'd like to say the 50-day line will be the bearish make or break point, but it sure wasn't in late June. Instead, we'll be using the lower Bollinger band as a bearish signal line. It's at 1488 right now, but as you can see, it was basically perfect support twice last month. If it fails, then look for more downside.
By the way, the S&P 500 is now 7.8% above the 200-day line, which is pushing its usual limits. That's the chief concern we have for the bulls right now.
S&P 500 Chart

Dow Jones Industrials Commentary
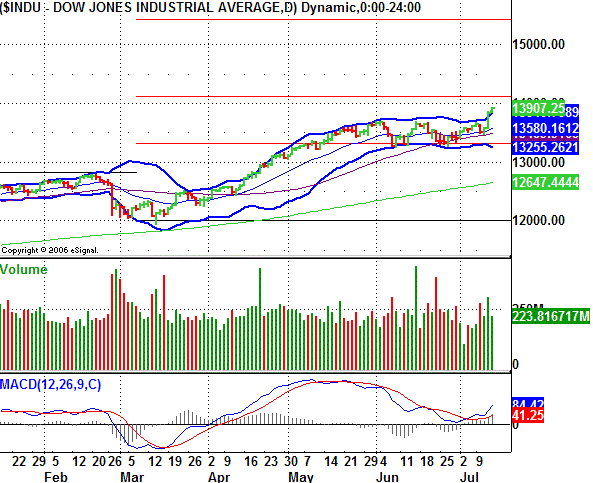
The Dow Jones Industrial Average gained 0.33% on Friday, moving higher by 45.52 points to end at 13,907.25. (Yes, that too was new all-time highs.) For the week, the average blue-chip was up 2.17%, as the Dow gained 295.57 points.
Once again applying Fibonacci lines, we'll establish an upside limit for the Dow at 14,104 (a 100% extension), and 15,443 (a 161.8% extension). We concede the latter seems almost implausible. On the other hand, the former seems almost meaningless, being only a couple hundred points away. We'll still watch it though.
The only thing we'll mention besides a new MACD crossover for the Dow is that it was the week's leading gainer. Though all the indices went up, is there a hint that folks are seeking out bigger, safer blue chip names. The rising tide lifted all boats, but the rotation appeared to be into the Dow's stocks. Just something to think about, as it can be an omen.
As with the NASDAQ, the Dow's 50-day average (purple) at 13,490 is going to be our bearish line in the sand. Just keep that in mind if we do indeed see the Dow slip a little after last week's red hot move - it deserves a break.
Dow Jones Industrials Chart

Price Headley is the founder and chief analyst of BigTrends.com.
|