| The McMillan Options Strategist Weekly |
| By Lawrence G. McMillan |
Published
07/20/2007
|
Options
|
Unrated
|
|
|
|
The McMillan Options Strategist Weekly
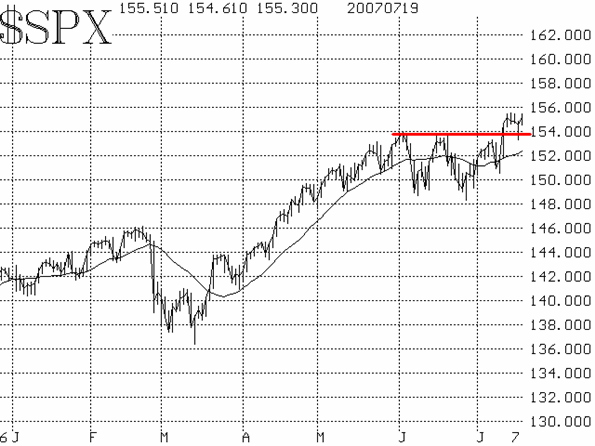
The various major indices have quite different charts. QQQQ is the strongest, continuing to build on the breakout from early July. The Dow and $SPX broke out last week, but the Dow's breakout has been stronger than that of $SPX. Regardless, the one over-riding certainty is that volatility continues to build. Some of the daily and intraday moves are really quite spectacular -- almost reminiscent of the pre-2003 markets.
Since we usually follow $SPX as being representative of the "broad market," we'll continue doing so. $SPX pulled back this week (Wednesday) to test the breakout level -- roughly 1540 -- and that test was successful (thanks to a late-day rally that day). Thus the chart of $SPX is bullish, as long as it continues to close above the area of that retest: 1535-1540.

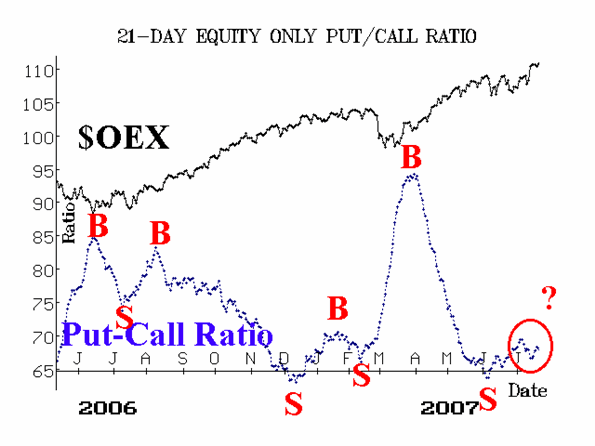
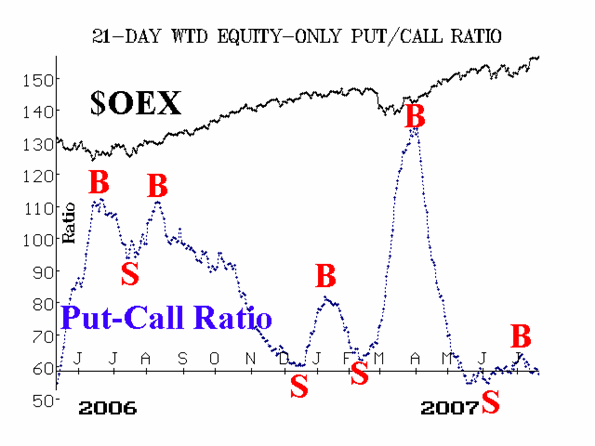
The other technical indicators are not quite so bullish. In fact, there are some divergences between the seemingly bullish action of the indices and the internals as measured by the various indicators. Consider the equity-only put-call ratios. They continue to waver at the lower end of their charts, but they are generally rising off their June lows. In other words, the broad indices are making new highs, which should be accompanied by the equity-only put-call ratios making new lows. However, that is not the case. In fact, the rising charts of the put-call ratios means they are on sell signals.

Market breadth presents a similar picture. Most of the time in the last several years, breadth has just followed the market. A strongly rising market produced strong breadth, while a falling market (when they have rarely occurred) produced very weak breadth. However, of late, breadth has not been keeping pace on the upside.

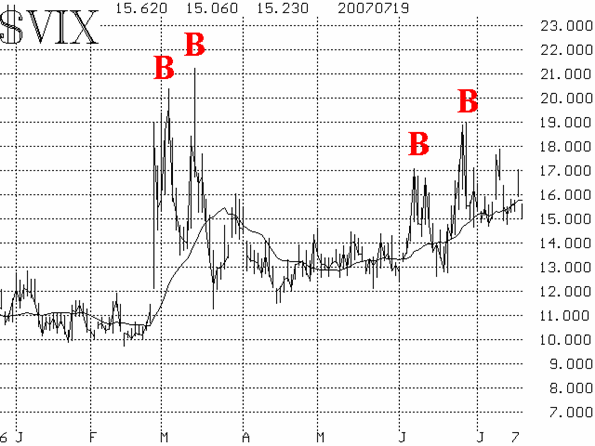
Volatility indices continue to rise. In the last four years, we have not seen such a steady rise in volatility -- nothing even close to it. It is partly justified, of course, by the fact that actual volatility is rising (the 100-day historical volatility of $SPX is up to 13% -- the highest it's been since it was on its way down through that level in 2003). And we know that volatility rose during much of the late 1990's strong bull market. So, everything could be bullish, even though about 75% of the time rising volatility is bearish. However, even if it is bullish, volatile markets usually mean that there will be plenty of big down days mixed in with the up days (witness this week's sharp decline on Wednesday). So, it's likely to be a potentially more dangerous environment in which one is going to have to operate with wider stops (and thus more risk).

In summary, the overall picture is bullish as long as $SPX remains above the 1535-1540 support level.
Lawrence G. McMillan is the author of two best selling books on options, including Options as a Strategic Investment, recognized as essential resources for any serious option trader's library.
|