Professional trader Price Headley provides a look at the stock market for the week of July 23.
NASDAQ Composite Commentary
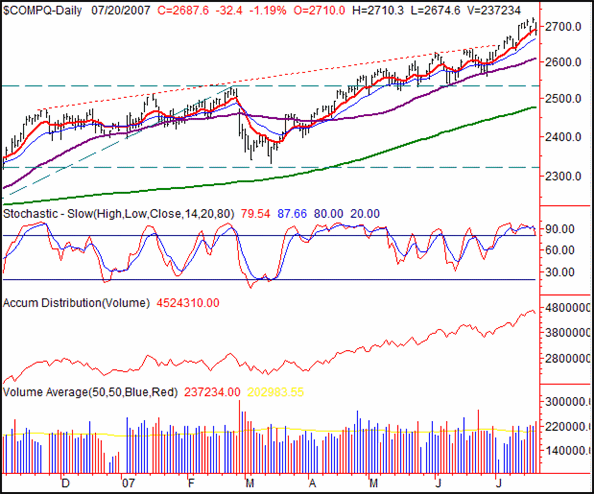
The NASDAQ Composite lost 32.4 points on Friday -- a selloff of 1.19%%. On a weekly basis, we saw the index close 19.4 points (-0.72%) lower. Despite the dip, the truth of the matter is, the composite is still within a bullish trend.
Most of the commentary is focused on the other two charts today, but we do want to point out one thing for the NASDAQ. It got so over-extended two weeks ago, an easing was (and still is) very likely. Just don't confuse that with something more. The 50-day line at 2607 is still the major line to watch. But, it's 80 points under the composites' closing level. And just for the record, the NASDAQ is still 8.5% above its 200-day line (green). That leaves a lot of ground to give up before a floor is found.
NASDAQ Composite Chart 
S&P 500 Commentary
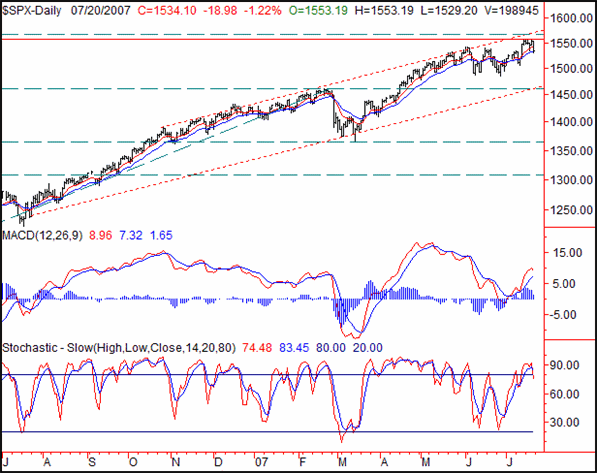
The S&P 500's close at 1534.10 Friday was the result of a 1.22%/18.98 point loss. That was 18.40 points lower than the previous week's close -- good for a 1.19% decline over the last five trading sessions. It's not that bad yet really. The SPX has been in this positions before and come out of it bullishly. However, we're now scrutinizing things.
For four of the last six sessions, 1555 was the ceiling. So, we're drawing a line there no matter what happens next. A move past it should be enough evidence that the bulls are staying on the job.
On the flipside, the SPX closed under the 10-day line on Friday. No big deal. We've seen it a lot recently. In fact, none of the key moving averages have meant much lately. So, we're not going to focus too much on them. The same goes for stochastics and MACD. The market has been so erratic from day to day lately, they haven't been useful.
We will, however, point out a bigger-picture bullish zone, framed by the dashed red lines. Extending to the right of the chart, you can see they leave more upside as well as more downside potential.The lower boundary is at 1461 right now, right in line with a major Fibonacci line. The upper edge is at 1566, also in line with a Fibonacci line. (Note that the support/resistance channel's levels will change while the Fibonacci lines will not.)
S&P 500 Chart 
Dow Jones Industrials Commentary
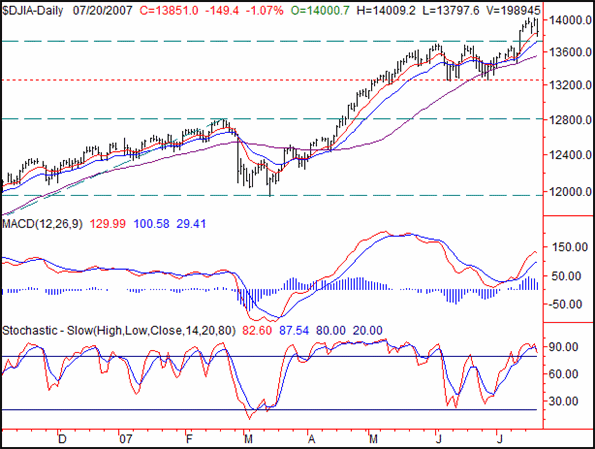
On Friday, the Dow Jones Industrials lost 149.4 points - or 1.07% - to close out at 13,851.4. For the week, that meant a loss of 56.3 points, or 0.40%. It's still not a reason for the bulls to panic - or for the bears to get excited. In fact, the Dow could fall even further this coming week, and it still really wouldn't be a bearish concern yet. That line in the sand is at 13,550.
Why 13,550? That's where the 50-day average (purple) currently lies. It was support in June, and unless we actually fall under it, we won't have any reason to believe it won't be support again.
Past that - and this is a big if - 13,259 becomes the key level to watch. We found support there twice in June. If that line fails too, then the Dow could be in serious trouble. How much trouble? A trip back to 12,000 is a possibility. Keep in mind the normal-sized correction during a bull trend is 10% or more. Anything less, and we don't get a good capitulatory event. Despite all the ups and downs for nearly two years now, we have yet to see the Dow do that. So far investors have remained largely oblivious to the danger - which is part of the reason all this buying has persisted. However, that's the reason we tend to talk a little more about the downside potential when we start to really reach new highs. Just something to keep in mind.
In the meantime, we're left watching the chart pretty closely. Note that MACD and stochastics may not mean a lot right now. To really signal a good downtrend, you may want to wait for the stochastic lines' re-entry into the sub-20 area. We become oversold briefly in March, but pulled out of that dive. To really get confirmation that a downtrend is in place, we suggest waiting for the stochastic lines to stay in oversold territory -- much the same way they stayed in overbought territory in April and May.
Dow Jones Industrials Chart 
Price Headley is the founder and chief analyst of BigTrends.com.