| The McMillan Options Strategist Weekly |
| By Lawrence G. McMillan |
Published
07/27/2007
|
Options
|
Unrated
|
|
|
|
The McMillan Options Strategist Weekly
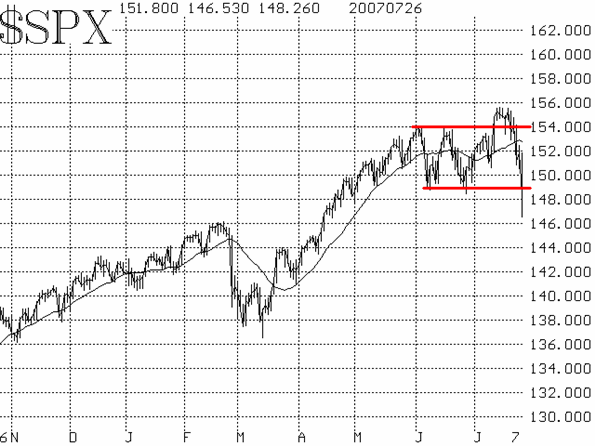
Several factors came together this week to produce a very nasty decline. The over-riding technical factor, in my opinion, was the breaking of the 1535 level on $SPX. If you'll recall, when both the Dow and $SPX broke out to new all-time highs (was it really only two short weeks ago?), $SPX left behind a well-defined support level at 1535-1540. This past Tuesday, when the market started its sharp decline, it was clearly noticeable that selling accelerated greatly as soon as the 1535 level was penetrated on the downside.
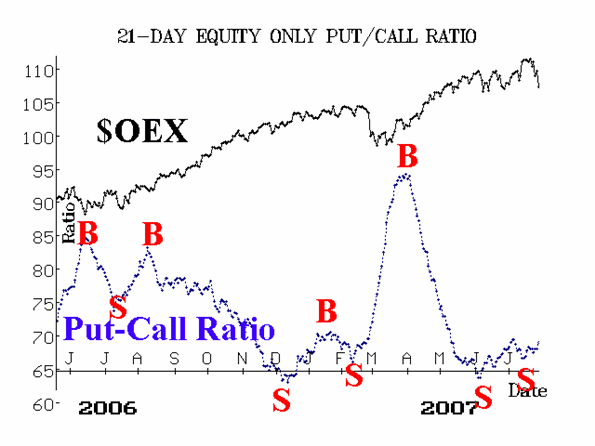
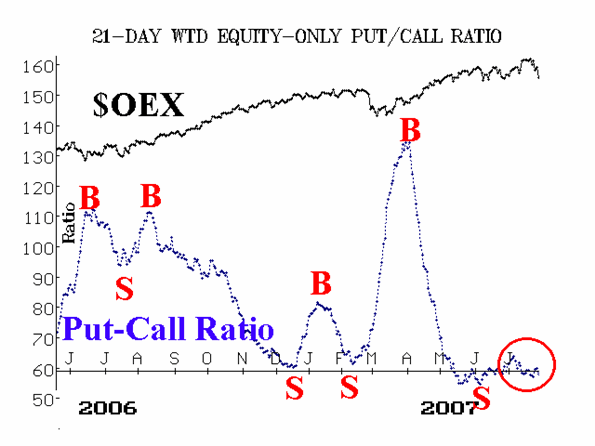
The equity-only put-call ratios have been neutral of late, as they have not trended in either direction. True, they are on the lower part of their charts, which is overbought territory, and there were sell signals a month or so ago, but recent action has not been conclusive from these indicators. Now, the standard ratio is back on a sell signal again.

Market breadth has not been a particularly useful indicator for some time. It has mostly just followed whatever the market was doing. But in the last couple of weeks, breadth diverged from the broad market. It did not rise to new highs when the Dow and $SPX did. But now breadth has become more meaningful. Currently, both breadth is extremely oversold. While this means that sharp, but short-lived rallies are possible, it is most definitely not a buy signal. Some of the worst declines occur while conditions are "oversold."

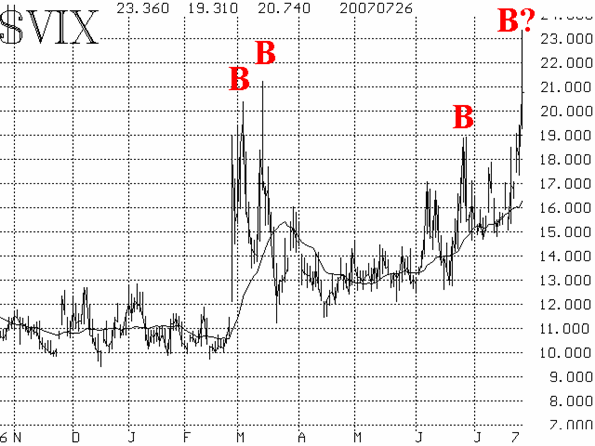
Volatility has continued to rise. $VIX spiked up to above 23 today, its highest reading since June 2006 -- and then April 2003 before that. It closed at 20.74, 2.62 below its peak. A spike peak in $VIX would be a buy signal. It hasn't quite qualified for that yet -- and often the very first spike peak is not the eventual peak -- but a close below 20 by $VIX would qualify as a spike peak buy signal.

To summarize the technical indicators then: the $SPX chart is bearish, having broken out on the downside; breadth is deeply oversold, but not yet on a buy signal; $VIX is potentially about to give a spike peak buy signal; and the equity-only put-call ratios are bearish. This adds up to an intermediate term bearish signal. However, because of the extreme oversold conditions in both $VIX and breadth, sharp but short-lived rallies are possible.

One plausible scenario is that the market rallies enough to satisfy the short term signals and work off the oversold conditions, and then declines to retest today's lows near $SPX 1465. If that holds and if the put-call ratios can roll over to buy signals, that might be the end of the decline. If not, a true correction -- which historically has been defined as a decline of 10% -- might well emerge, taking $SPX down to 1400 or slightly lower.
Lawrence G. McMillan is the author of two best selling books on options, including Options as a Strategic Investment, recognized as essential resources for any serious option trader's library.
|