| Understanding Price Gaps on a Stock Chart |
| By Andy Swan |
Published
07/28/2007
|
Stocks
|
Unrated
|
|
|
|
Understanding Price Gaps on a Stock Chart
Simply put, a price gap is an area on a chart where no trading has taken place. There can be gaps in an uptrend when the prices open above the previous day's highest price and that space is not filled during the day. In a downtrend, the highest price of the day is below the previous day's low. Upside gaps signify market strength, whereas, downside gaps show weakness. Although gaps are mostly seen on a daily bar chart, which is very signifcant to a trader who is day trading, they do appear on weekly and monthly charts and are very significant then to swing and options traders.
Here is a chart of TASR, where you can see 3 gaps that took place:
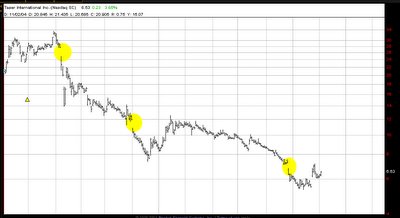
One of the biggest myths associated with the intrepretation of gaps is that "gaps are always filled." Not true; some gaps should be filled and some should not. Let me also add, depending on which of the three types of gaps it is, breakaway, runaway or exhaustion, the gap will have different forecasting implications.
Andy Swan is co-founder and head trader for DaytradeTeam.com. To get all of Andy's day trading, swing trading, and options trading alerts in real time, subscribe to a one-week, all-inclusive trial membership to DaytradeTeam by clicking here.
|


 Free Festival of Traders Videos