| Weekly Outlook in the Stock Market |
| By Price Headley |
Published
07/29/2007
|
Stocks
|
Unrated
|
|
|
|
Weekly Outlook in the Stock Market
Wow! What a week, huh? One of the worst in years, which on the surface may seem bearish. The reality is we’re actually inclined to be bullish, in the sense that things couldn’t get any worse. Admittedly, we’d like to se what happens Monday and Tuesday just to get some confirmation, but we’re actually seeing some data that suggests the bottom has already been made -- a short-term bottom anyway. The Fibonacci retracement lines tell a lot of the story.
NASDAQ Composite Commentary
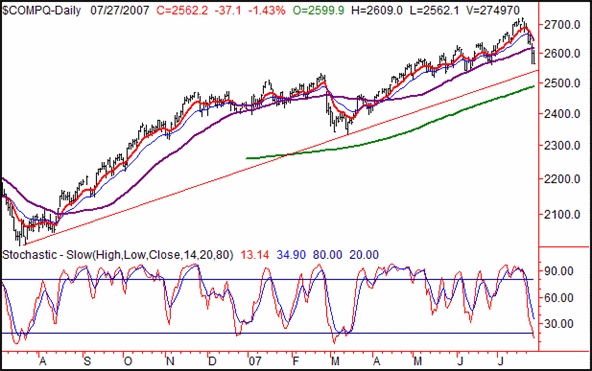
Losing another 1.43% (-37.1 points) on Friday left the NASDAQ Composite at 2562.2. That was a 4.67% dip (-125.4 points) on a weekly basis.
First and foremost, we’re not even going to argue that the momentum tools look bearish. What we’re really trying to determine today is whether or not it’s over. As for the NASDAQ, based on history it may well be. Though we’re not quote there just yet, you can see the composite is close to being back to a long-term support line (thin, red). We also have to point out how the last time we were headed to that line, the bars looks about the same - violently bearish, but able to stop and turn on a dime. We’re also stochastically almost oversold. The 5.9% plunge from the recent peak of 2724.7 should also be a nice healthy pullback, and a release of any overbought tensions.
NASDAQ Composite Chart - Daily
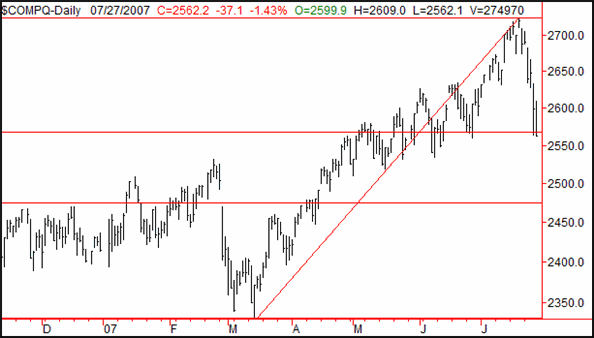
We’ve been able to really key in on the Fibonacci retracement levels to spot potential turning points that weren’t otherwise indicated by other things. We’ve plotted new Fib lines today, from March’s bottom to July’s peak. The 38.2% retracement level is at 2567.80, basically Thursday’s and Friday’s lows. So, this is indeed a potential bounce point. If that Fibonacci line doesn’t hold up as support, a revisit of the next one at 2475.30 is possible.
NASDAQ Composite Chart & Fibonacci Retracement Lines- Daily
S&P 500 Commentary
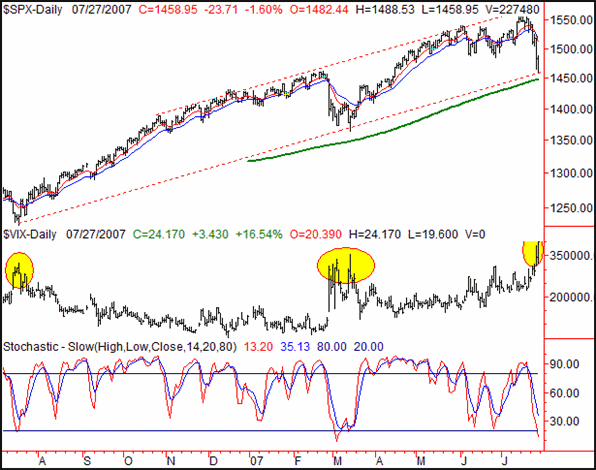
The S&P 500’s close of 1458.95 on Friday was 23.71 points lower than Thursday’s, a 1.6% loss. For the week, the large cap index was 4.9% lower, losing 75.15 points.
There are only two things we need to mention about the SPX’s chart.
First, notice how the index has come all the way back down to the lower edge of its generally bullish trading zone. Assuming that support line is valid, then we’re by default due for a rebound now.
The other thing we want to examine is the VIX. It hit new multi-year highs on Friday. Granted, it wasn’t a great day or even great week for the market, but it wasn’t commensurate with new multi-year readings for the VIX. And, it was indeed a spike -- a peak in fear. The last two times we saw this happen, it came right in front of a major upside move for the market. Yes, it seems impossible for stocks to make it a three-peat. A lot of seemingly impossible things have happened before though.
With that in mind (and before we look at the SPX’s Fib lines), if the market doesn’t bounce soon and the support lines break down for all the indices, then look out below, as we may be in a seriously bearish tailspin. The 200-day line (green) at 1448 is the last straw.
S&P 500 Chart - Daily
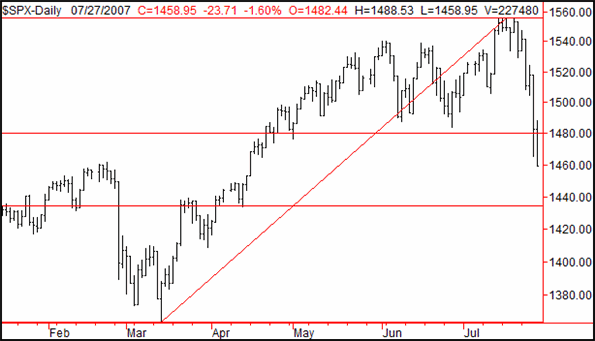
The S&P 500’s Fibonacci lines apparently didn’t mean much. The 38.2% retracement line at 1480 wasn’t support, and the 61.8% retracement line at 1434 hasn’t come into play yet. We’ll keep watching them all the same, but can’t draw anything meaningful out of them right now.
S&P 500 Chart & Fibonacci Retracement Lines - Daily
Dow Jones Industrials Commentary
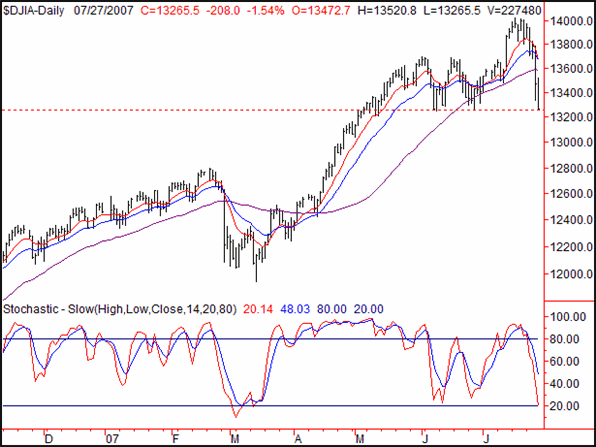
The 208 point dip (-1.54%) for the Dow Jones Industrials on Friday was just part of an even bigger pullback. The close of 13,265.5 was 585.5 (-4.23%) below the previous week’s closing level.
Check out Friday’s low for the Dow. It was nearly a perfect match with both of June’s low points, near 13,250. Can this really be a coincidence? Maybe, but a heck of one if it is. Regardless, we’re going to assume that’s a support line until we have no reason to.
That being said, this chart has a huge possibility of setting up a head-and-shoulders pattern. We already have a shoulder and a head. We’re not there yet, but keeping a watchful eye.
Dow Jones Industrials Chart - Daily
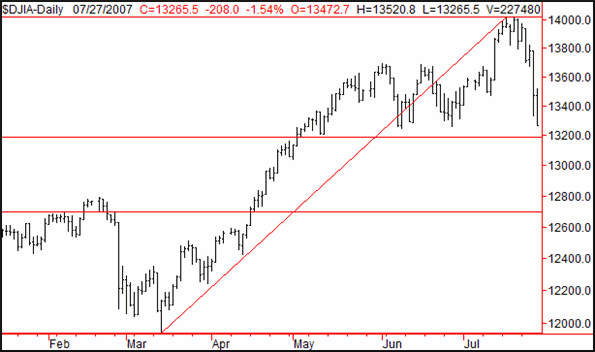
As for the Dow’s Fibonacci lines, it’s pretty, much the same story. The first retracement level (a 38.2% retracement) is at 13,190, just a tad below where we are now. So, this leaves open the possibility of a little more downside before this chart might start to mend itself.
Dow Jones Industrials Chart & Fibonacci Retracement Lines - Daily
Price Headley is the founder and chief analyst of BigTrends.com.
|