| A Mid-Week Look at the Market |
| By Price Headley |
Published
08/1/2007
|
Stocks
|
Unrated
|
|
|
|
A Mid-Week Look at the Market
Today may well be the pivot point, but even if it's not, the indecision is shining through. The market has flipped back and forth from being in the red and the black a few times today, lending itself to the possibility that we are indeed trying to make a bottom. That still may take a few days, but it's easily an idea worth exploring.
NASDAQ Composite Commentary
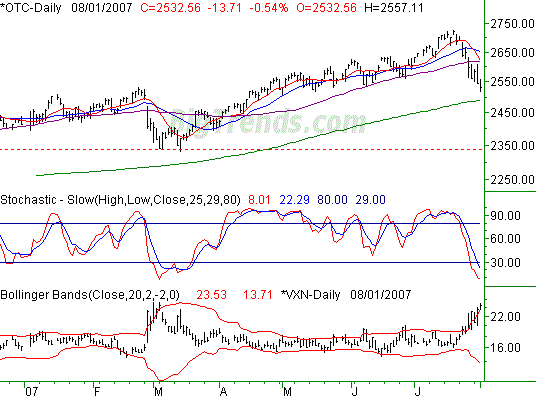
As of right now, the NASDAQ is in the hole by 0.54%, down 13.71 points. For the week, it's lower by 26.98 points, or 1.16%.
Based strictly; on this chart, things look bleak. The problem is, they looked this bleak in March, yet a big fat 16% rally followed. Looks like that was too much to hold onto though, as the composite is now 7% under its recent peak of 2724.74. Perhaps it was enough to bleed off all that pressure.
Based on the size of the pullback, being stochastically oversold (something that hasn't been allowed to persist much lately), and the VXN really being stretched higher now, we still suspect a big bounce could be in the works.
Our make-or-break line for the NASSDAQ Composite is now the 200-day line (green), at 2490.
NASDAQ Composite - Daily

S&P 500 Commentary
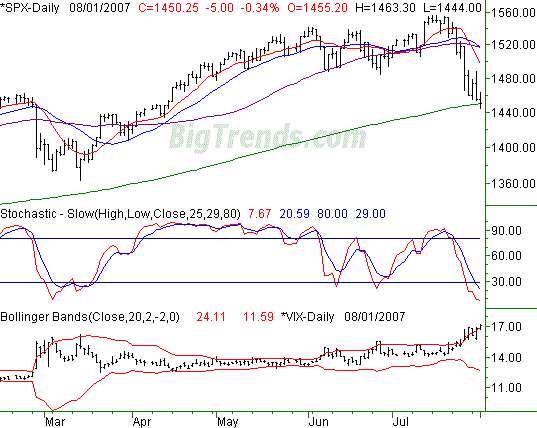
The S&P 500 is currently lower by 0.34%, or 5.0 points. The current trading level of 1450.25 is 8.7 points below Friday's close, down 0.6% week-to-date.
Pretty much everything we mentioned about the NASDAQ applies here as well. Just substitute the VIX for the VXN. The one thing we'll point out about the SPX is that it's already touched its 200-day moving average line today. So far it looks like it's holding up as support. That's a very big deal, though we'll let the two duke it out a couple of days just to be sure it's going to hold its ground.
S&P 500 - Daily

Dow Jones Industrials Commentary
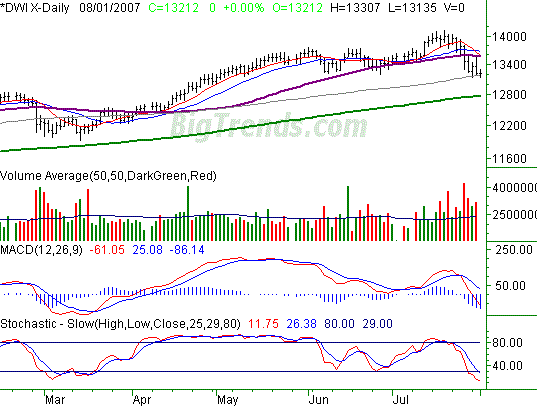
The Dow is the only index to spend most of its time in profitable territory today. Right now it's up just a hair. We'll call it a break-even. For the week, though, it's still underwater, down 53 points (-0.4%).
Once again, this chart looks ominous, but once again, we're looking for a rebound from here. Rather than the 200-day line being in view, the Dow seems to have found a floor at its 100-day moving average line. Being well oversold in addition to that support suggests a bounce is nigh. A close under the 100-day average is the only thing that could negate our view; it's at 13,182.
On the flipside, since we can, let's establish some resistance lines for the Dow as well. The obvious choice is the 50-day line (purple) at 13,571. The 10-, 20-, and 50-day line are all right around there, so that's a pretty good wall to get across. But, a move back up to 13,670 - and above the last of those three lines - could really spark a bullish fire.
Dow Jones Industrials - Daily

Price Headley is the founder and chief analyst of BigTrends.com.
|