| A New Complexion for the VIX? |
| By Price Headley |
Published
08/2/2007
|
Futures , Stocks
|
Unrated
|
|
|
|
A New Complexion for the VIX?
Is anybody else as tired of hearing about the VIX's recent spike as I am? Just kidding. It's an important event, and one I ultimately think will be a pivotal point for the market. But, no matter how we slice it at this point, now we just have to bide our time. Either the spike will result in a market bounce, or it won't.
In the meantime, as we were trying to find some comparable scenarios for the VIX's current chart, something else kind of struck me. It's nothing that requires immediate action - just something you need to be aware of for the next few months or even years.
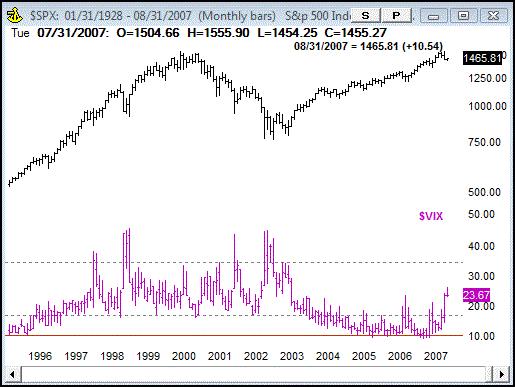
Remember back when the VIX used to bounce back and forth (well, up and down, technically) between 20 and 35? Hitting those extremes were - for the most part - a turning point for stocks. Or, at least that's the way it was between 1997 and 2003. Before that, sub-20 readings were normal. And after 2003, the VIX again got comfortable staying under 20.
More importantly, the VIX did its job as volatility predictor. Stocks have certainly done well since 2003, and it has indeed felt a little volatile. However, this is nothing like the craziness we were going through between 1997 and 2003, when the VIX was much higher
However, you may want to take a real good, close look at the monthly VIX chart below. Yesterday's new multi-year high for the VIX really shouldn't be a surprise. This has been coming since January. It was at that point we started to see higher lows - consistently. If you look even closer, you can see the VIX found a flat support area around 10 between 2005 and the end of 2006. In other words, I think we're on the verge of starting a new era for the VIX, or at least setting new normal levels.
S&P 500, With VIX - Monthly

The implication for all of us? Maybe it's time to put away the 10/20 range expectations for the VIX, and raise the expectation back up to between 20 and 35. No, we won't see the paradigm shift happen overnight; I suspect we'll need several more months to make the full adjustment. Between then and now (and even afterwards), I strongly suggest using Bollinger Bands to spot the extreme readings for the VIX.
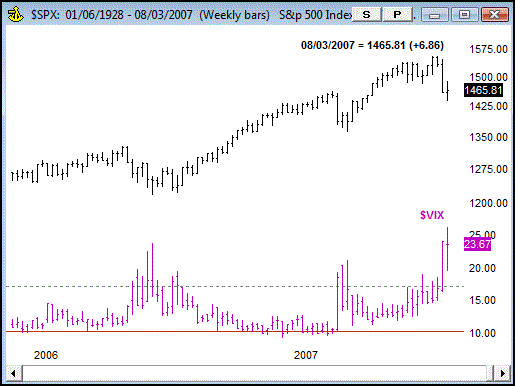
The other adjustment we might need to make - if the VIX really is beginning a new era - is to trade accordingly. If you again look closely, you'll see the market has been going higher since April, but so has the VIX. This goes back to point number one. We all got used to the VIX falling while stocks were rising between 2003 and 2006. We may not have it so lucky going forward. Now, we'll have to scrutinize between fear spikes, and just generally rising levels. The former is still bullish, but the latter isn't necessarily bearish. And regardless, a higher VIX will be accompanied by even greater volatility.
S&P 500, With VIX - Weekly

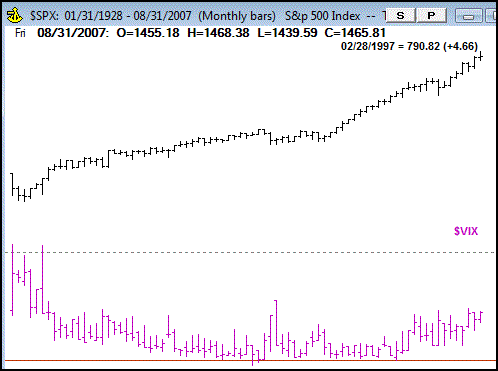
One final thought - once again, take a look at the chart below. Looks familiar, doesn't it? It's just another shot of the S&P 500 moving higher while the VIX made a bowl shape and finally started to trend higher.
S&P 500, With VIX - Monthly

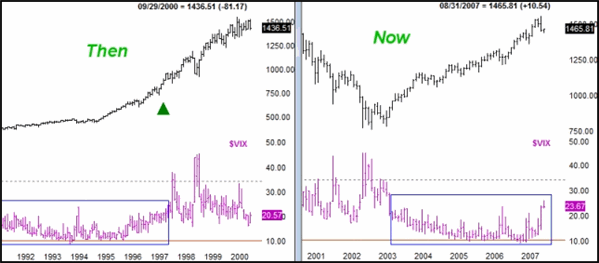
The only problem is, that chart ain't of the action between 2003 and now. That's the chart from 1992 to 1997. It looks eerily familiar though. Here are the two side by side:
S&P 500, With VIX - Weekly

What I can't seem to get past is what happened in 1997 after the VIX started trading above 20 on a consistent basis. It was a monster rally. Could the same thing happen again? Can the market's next three years make the last three years - which were pretty solid - look like child's play? It's already happened once. It may take months to really materialize, but if the S&P 500 and the Dow get past and stay ablev all-time highs (reached recently), I'm not going to fear it, even if the VIX starts to get comfortable between 20 and 35. The economy has stabilized enough to suit the Fed, judging from the decision to stand pat on interest rates. Plus, the slump in housing is going to keep the Fed motivated to keep rates low. That's a heck of an environment for stocks to flourish in.
This is definitely a bigger picture idea, but something worth thinking about.
Price Headley is the founder and chief analyst of BigTrends.com.
|