|
Weekly Outlook in the Stock Market
Don't overreact to Friday. Yeah, we know that's like telling the sun not to rise. However, it was strangely bearish, while only on limited volume. If it was indeed an omen of worse to come, there should be plenty more downside opportunities to take advantage of. If it was instead -- as we suspect so far -- too bad to be true, then we may finally get that bounce we've been expecting. Given what's at risk here, we'll spend today looking at both the bullish and bearish possibilities, and how to spot which one is playing out.
NASDAQ Composite Commentary
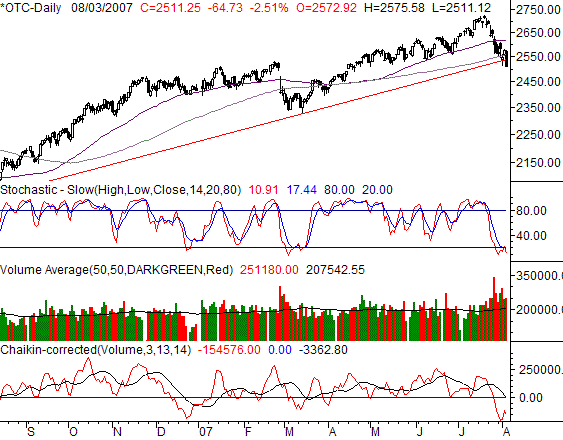
Friday's loss of 2.51% left the NASDAQ Composite at 2511.25, lower by 64.73 points. For the week, the index still only closed lower by 2.15%, or 55.09 points below the prior Friday's closing level. The massive daily loss has us thinking things now look far too enticing for the bulls to pass up on Monday. Big moves invite big reversals. However, a couple of minor nuances also have us being vary cautious now.
The red flag is the move under the long-term support line (red). Now, when you're looking at timeframes of this length you can't expect perfection, so we're not absolutely saying a slight close under support is a sure-fire sign of more downside on the way. We're just saying this is something to be aware of. It could turn for the worse.
On the flipside, you'll also see we're stochastically oversold on the COMP -- for the first time in a long time. We may stay oversold for a while, but this ups the odds of a rebound soon. Remember, the true "buy" signal for us is the point when both the %K and %D lines pop back above the 20 level.
By the way, from the recent peak at 2724 to the close at 2511 is about a 7.8% tumble. That's pretty big, but still not the full 10% considered by many to be the healthy and right-sized corrective move to really let the market "get it all out of its system." By the way, the thick green line is the 200-day moving average line, currently at 2491. That could be support.
NASDAQ Composite Chart - Daily
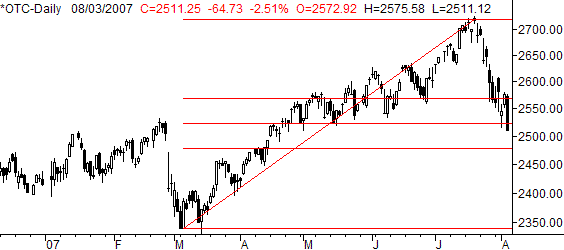
Here's the latest update on the NASDAQ's Fibonacci lines. It looked the 50% retracement mark (not actually a Fibonacci line, but still important) was going to be a support area. However, it failed on Friday. The next likely landing pad is the 61.8% retracement level at 2478, slightly under the 200-day line's current reading of 2491. If both of those lines fail to hold the market up, then we could really have problems.
NASDAQ Composite Chart with Fibonacci Lines - Daily
S&P 500 Commentary
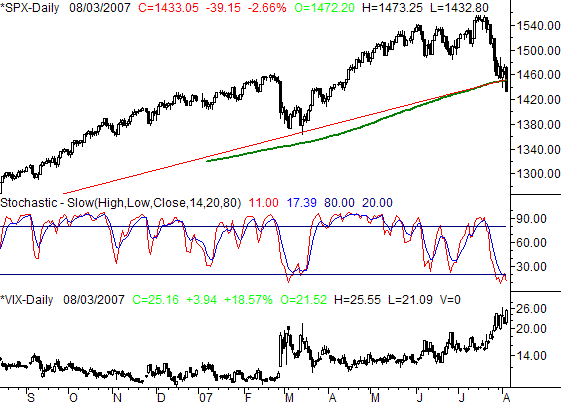
Friday's 39.15 points loss (-2.66%) left the S&P 500 at 1433.05. Had it not been for that one session, the large caps would have actually ended in the black for the week. Instead, they closed 25.90 points under the previous week's close, down 1.78%.
Bigger than that, the S&P 500 also made its first close under the 200-day moving average line. You can also see the S&P 500 made a move under a key long-term support level. This isn't exactly a sign of bullishness.
The bullish argument emerging from all of this, however, is the same idea as above. It was so bad and so bearish last week that the index is finally and truly oversold. Therefore, we're ripe for a bounce. So far the argument is nothing more than a theory, as the momentum is clearly with the bears right now.
We've also plotted the VIX's chart. No discussion about it. You already know our take. Its recent surge also hints that we're ripe for a rebound.
S&P 500 Chart - Daily
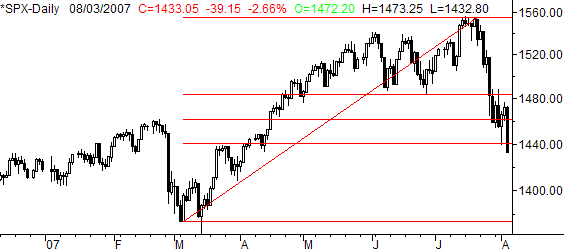
As for the SPX's Fibonacci lines, technically speaking, the 61.8% retracement line at 1440 failed to hold the index up. According to the premise, the next floor won't be found until 1374, a full 100% retracement, and back to March's lows. (Bear in mind this Fibonacci strategy is no more perfect than anything else, so we're not blindly expecting that to necessarily play out.)
S&P 500 Chart with Fibonacci Lines - Daily
Dow Jones Industrial Average Commentary
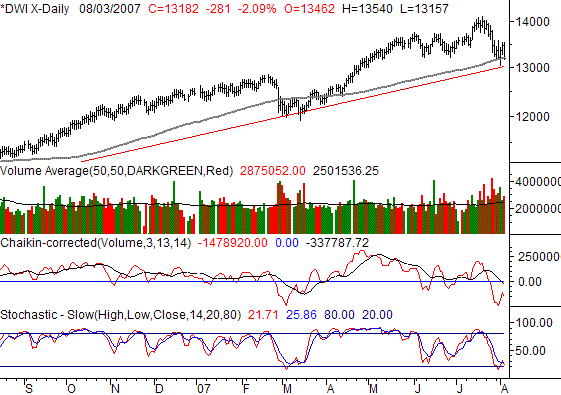
The 281 point loss the Dow took on Friday was the biggest for the week, and one of the biggest in years. The blue chip index closed at 13,182, down 2.09% for the day. For the week, that meant a close 83 points lower (-0.63%) than the prior Fridays closing level. Though we still anticipate a rebound soon, the Dow's chart also suggests a little more downside may need to play out.
Unlike the other two indices, the Dow managed to find support at its long-term lines -- the 100-day line (grey) as well as the straight-line support (red). And yes, like the other two indices, the Dow is officially oversold. As long as the 100-day line at 13,195 and/or the support line at 13,017 remain intact, the index has a good shot at recovering.
Dow Jones Industrial Average Chart - Daily
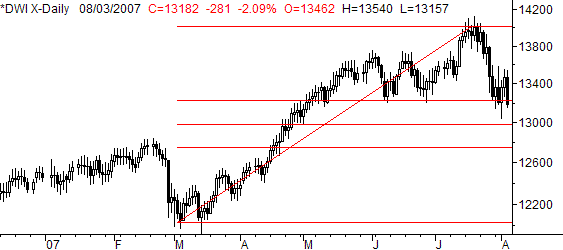
As for Fibonacci lines, the Dow seems to be holding its ground at the first 38.2% retracement level of 13,228. The 50% line is at 12,983, while the 61.8% line is at 12,752.
Dow Jones Industrial Average Chart with Fibonacci Lines - Daily
Price Headley is the founder and chief analyst of BigTrends.com.
|