In our last episode, we identified an "either-or" daily indicator that worked with identical parameters across an array of financial markets. Today we'll present a second "either-or" indicator, meaning each day signals either a long or a short and almost never a neutral. Again, the hope is that such elemental indicators will lend themselves to even better returns when combined together.
Today's bias concerns the order of an extreme high close verses an extreme low one. If the lowest low occurs before the lowest high, that suggests an upmove and vice versa if the high comes first. In TradeStation Easy Language, it reads as follows:
Input:m(50);
if highestbar(c,m)>lowestbar(c,m) then buy next bar at market;;
if highestbar(c,m)<LOWESTBAR(C,M) next market;
setexitonclose;
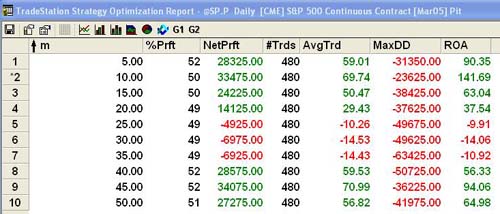
In English, if the highest close in the last "m" number of days occurs before the lowest low, then enter a long on the next opening and vice versa for shorts. What's “m”? It can be any one of several numbers as the Figure 1 optimization report demonstrates. We'll settle on 50 even though there are better numbers in our 10 trials. Ten is actually best but 50, however, is the most robust across the array of indexes, bonds and currencies we follow.
The testing period was from January 1, 2003 to February 11, 2005. Figure 1 is optimization.

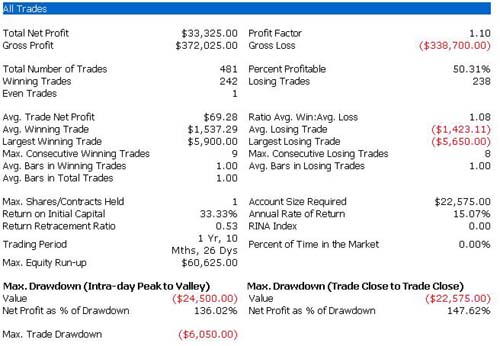
Figure 2 is a performance summary of the full-sized S&Ps.

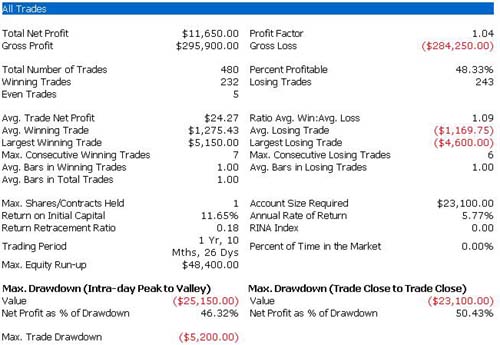
Figure 3 is a performance summary of the full-sized Nasdaq.

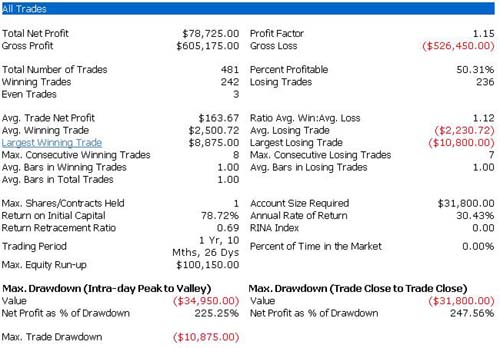
Figure 4 is a performance summary of the full-sized Russell.

Additional performances

Art Collins is the author of Market Beaters, a collection of interviews with renowned mechanical traders. He is currently working on a second volume. E-mail Art at artcollins@ameritech.net.