| A Mid-Week Look at the Market |
| By Price Headley |
Published
08/9/2007
|
Stocks
|
Unrated
|
|
|
|
A Mid-Week Look at the Market
It’s hard to believe the market was in dire straits less than a week ago. And, perhaps you shouldn’t forget it. We could be back there fairly easily, even with the last couple of bullish days under our belts. True, the odds seem to still favor the opposite (heavily), but the March recovery move needed a couple of running starts to get going.
NASDAQ Composite Commentary
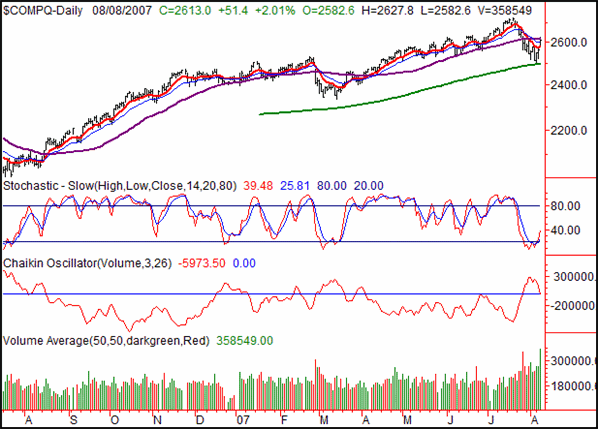
The NASDAQ was Friday’s leader, rallying a whopping 2.01% to close at 2613.0. That was 51.4 points higher than Tuesday’s close, and a nice 101.7 points better than last Friday’s close. Week to date, the index is up 4.05%, which incredibly is not the best performance for the week.
There are two key reasons we think this rally has legs, or will soon.
Reason #1: Volume. There was plenty of it on Wednesday, and more than average on Monday and Tuesday. To quantify the subjective into objective, we’ve added a Chaikin line to our chart. For this particular Chaikin line, down means a bullish volume trend, while up means a bearish one (don’t ask us why - it’s just this software). More importantly, we’re going to see a bullish Chaikin line cross of the zero line on Thursday (it can’t be prevented).
Reason #2: The reversal at the 200-day line (green) was decisive and swift. This is t to say it’ll be nothing but buying from here on out. In fact, we suspect a couple of bearish retests and false starts. However, the capitulatory action created by almost all bottoms has already been logged last week or the week before. As long as the 20-day line holds up as support on any subsequent pullback, we think the NASDAQ’s buy signal will remain intact.
As for targets and stops, we’ll add those in this weekend’s updates.
NASDAQ Composite Chart

S&P 500 Commentary
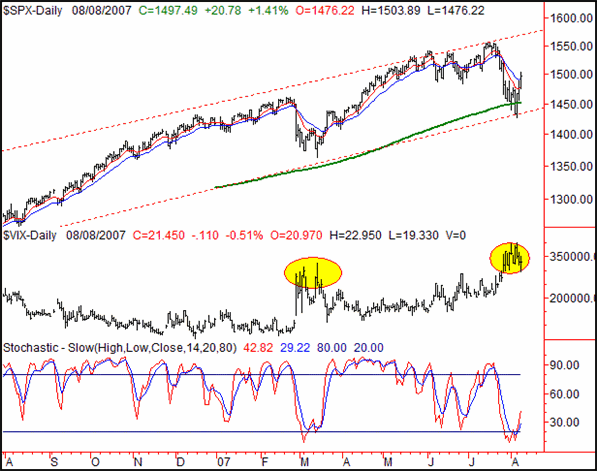
On Wednesday, the S&P 500 rallied 20.78 points, or 1.41%, to end the day at 1497.49. Week to date, the index is ahead by 4.5%, or 64.43 points. That more than offsets the prior weeks losses, but doesn’t undo the cumulative damage started two weeks ago. It sure is a start though.
Take a close look at the stochastic chart. E now have a full-blown buy signal here, as both the %K line (red) and the %D line (blue) are back above 20. Between that, and the fact that the SPX shot back above the 10- and 20-day averages (and in the wake of last week’s monster ‘new lows’ buy signals), we’ll go ahead and make the bullish call here.
As for an upside target, we’ll still key in on that upper edge of the bullish range, defined by the red dashed lines. It’s currently at 1569, but inches a little higher each day. So, as for where the bull may finally stop, that depends on how quickly they approach that upper extreme. In this instance, it’s actually to their advantage to take it nice and slow, pro-longing the intercept with the upper side of the bullish zone. Unfortunately, based on this week’s gigantic moves, the move is not starting out in a moderated fashion.
S&P 500 Chart

Dow Jones Industrials Commentary
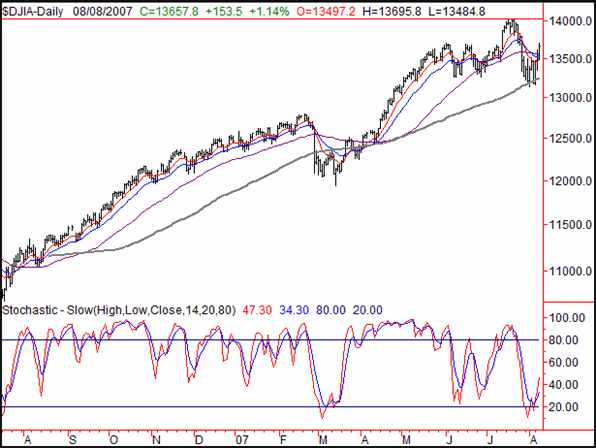
The Dow managed to add about 153.5 points to its total on Wednesday, gaining 1.14% to end at 13657.8. That’s 475.8 points higher than Friday’s close, translating into a gain of 3.61% for the week so far. Perhaps more importantly, we do have all new buy signals for the Dow now that it’s back above the 10- and 20-day averages (red and blue, respectively). Now all we need is confirmation, which is likely to come on Thursday.
Note that the Dow is closest to reclaiming all-time highs. at 14,022. Normally we’d be inclined to sell into strength (counter to the conventional wisdom that you "buy new highs"). In this case though, given everything we know about recent history, we actually expect a move into new high territory to spur anther big bullish move.
Dow Jones Industrials Chart

Price Headley is the founder and chief analyst of BigTrends.com.
|