| Weekly Outlook in the Stock Market |
| By Price Headley |
Published
08/12/2007
|
Stocks
|
Unrated
|
|
|
|
Weekly Outlook in the Stock Market
NASDAQ Composite Commentary
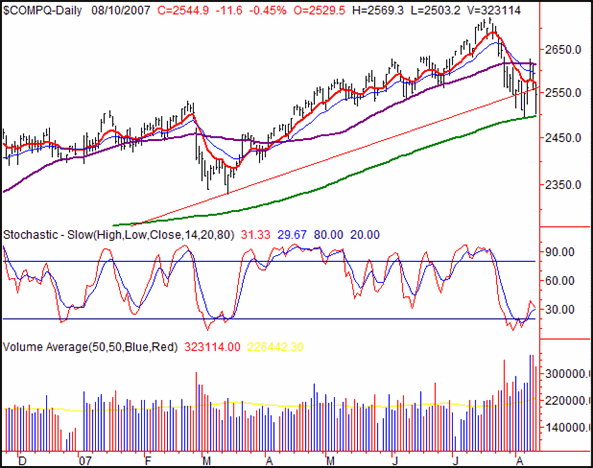
On Friday the NASDAQ composite lost 0.45 percent, or 11.6 points, to end the day at 2544.9. For the week, however, it still managed to gain 33.6 points, or 1.34 percent. It was the second time we saw a brush of the 200-day line, but we also saw resistance at the 10-day moving average line. Wednesday and Thursday, we actually saw a support at the 10-day line, yet we saw a resistance at the 50-day line. What a mess.
We're still basically saying the same thing though. That the dip is likely to be just temporary, and we're due for a rebound. If we're wrong, we'll know soon enough, as the 200-day line will break down as support. It's currently at 2497, just so you know. The 50-day moving average line is at 2616. The contest at this point is mainly to see which one breaks first. Like we said, we think we're past the capitulation point and poised for a recovery.
NASDAQ Composite Chart - Daily

S&P 500 Commentary
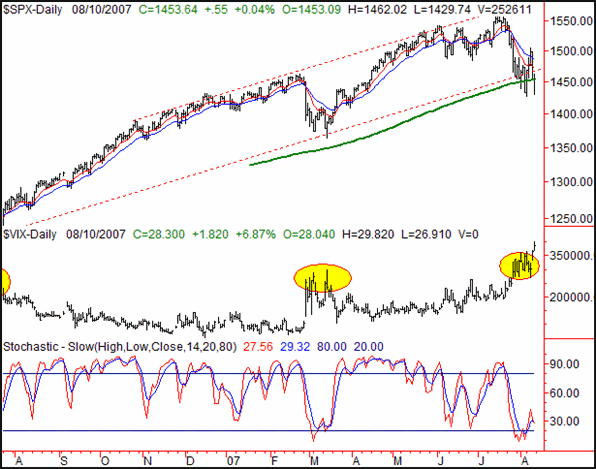
The S&P 500 was the only index to make a gain on Friday, but it was still small one. The average large cap only gained 0.04 percent, as the index only added 0.55 points. The close at 1453.64 was still 20.58 points higher than the prior Friday's close, a 1.44 percent gain for the week.
At this time last week, it looked like the 200-day moving average line might act as support. Since then, the bulls haven't seen quite enough support for them to get or stay comfortable. The index closed right at its 200-day moving average on Friday after trading under it for quite some time. Simultaneously, it looked like the 20-day moving average line was a trouble spot when the index threatened it on Wednesday and Thursday.
The argument is still the same though. The recent sell-off was so harsh and so rapid, the pump is primed for a bounce.
We've been following the VIX closely for a while now, as it's continued to hit new multi-year high's. Yet another one was reached on Friday with a high of 29.82. It was the second day in a row the VIX gapped higher, and we have to wonder now if it's truly at the extreme limit to which it possibly move. We have to think it is.
Things are a little at odds right now. Based on current momentum alone, the shape of things to come is bearish. On the other hand, there are far too many reversal signals already in place to ignore. So, here's how we're playing it: we need to see the VIX close lower and the S&P 500 close at least back above its 10-day moving average line (at 1470) soon. Otherwise, nervous traders may have too much time to assume the worst. On the flip side, if we get to consecutively lower closes under the 200-day line, and the VIX just keeps drifting higher, the market may have a real problem.
S&P 500 Chart - Daily

Dow Jones Industrial Average Commentary
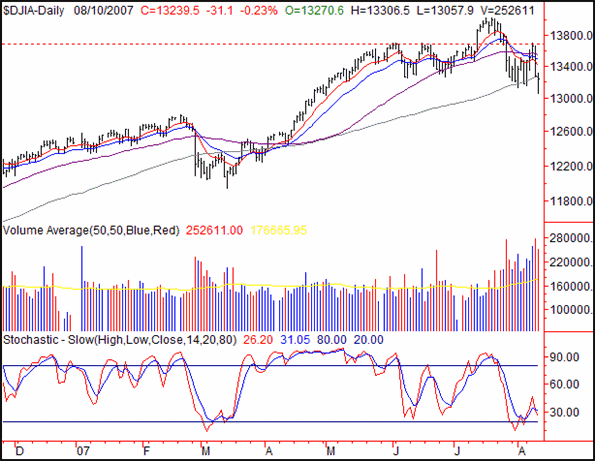
The Dow had a 0.23 percent dip, and left the blue-chip index at 13,239.5. On a weekly basis though, that was still good for a 57.5.gain, up 0.44 percent from the previous week's close.
Interestingly, the Dow is the only index to have made new multi-week lows on Friday. We had mentioned several days ago the possibility of a bearish head and shoulders pattern here, and now we're forced to wonder if we were right. We're not really concerned yet, but we could be soon.
Like the other two indices, we expect the Dow to pull itself up from this selloff. However, that's hardly a safe bet right now. The 10- and 20-day lines are back under the 50-day moving average, and the Dow itself actually closed under it the 100-day line on Friday. Then again, the exact same thing happened in March, and the bulls came back with a vengeance then.
At this point, the most conservative play you could make would be to wait for a move back above the resistance at 13,690. If instead there's more downside in store, that can be indicated by lower lows on rising volume. More on that next week.
Dow Jones Industrial Average Chart - Daily

Price Headley is the founder and chief analyst of BigTrends.com.
|