|
The McMillan Options Strategist Weekly
Week after week, this market becomes more volatile. Today's strong turnaround in the broad market was just a case in point. We are going to try to take a slightly longer-term view, even though there are so many gyrations in one week's trading in this current market. Our overall viewpoint is pretty much the same as it has been for some time: we remain intermediate-term bearish, while recognizing that the deeply oversold condition can produce sharp, but short-lived rallies (one of which likely began today).
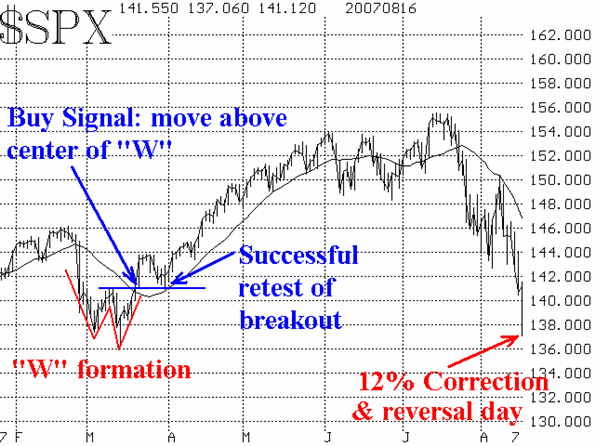
The S&P 500 Index ($SPX) has been extremely volatile, especially after violating major support at 1430-1440 on Tuesday of this week. That quickly led to a test, and violation of the next support area at 1410 (the area from which the Spring rally was launched), which in turn led to a full-blown retest of the March lows circa 1380 on $SPX. This waterfall decline finally enabled $SPX to correct 10% for the first time in 4-1/2 years, ending the longest hiatus in history between 10% corrections. These facts barely begin to describe what has happened, but let's concentrate on what might happen in the future.
First of all, I do not consider today's retest to be the bottom. It is coincidence that it occurred at about the same level as March, but typically markets don't bottom in a "V" fashion, but rather in a "W" fashion. So, we expect this rally to be strong enough to alleviate the oversold condition, and then for the market to return to the vicinity of the lows for a retest. If the technical indicators are more favorable at that time (i.e. breadth oscillators are higher, $VIX is lower, and so forth), then a true intermediate-term bottom will be at hand. These patterns are often repeated near market bottoms, and these days things happen very fast.

In fact, after the current short-term rally runs its course, and the retest occurs, the point to keep your eye on will be the top of that short-term rally. If the market moves back above there, then a much stronger buy signal will be in place. All of the significant points are marked on the $SPX chart, Figure 1, in February.
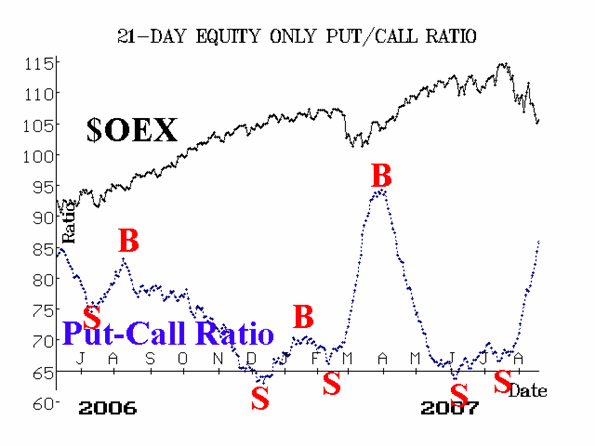
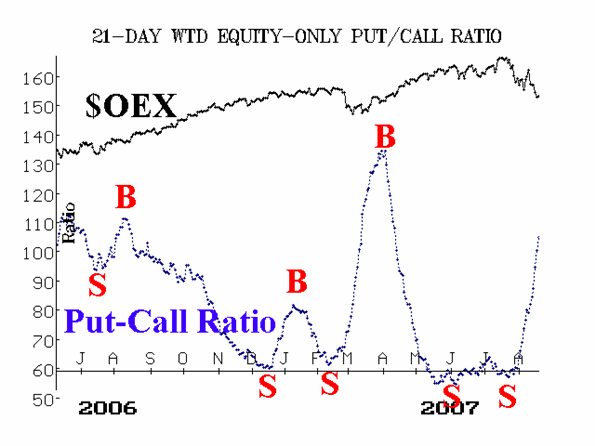
As for the other technical indicators, the equity-only put-call ratios have remained steadfastly on sell signals for some time now. They are rapidly moving up their charts, and thus are getting more oversold, but they will not issue buy signals until they roll over and begin to trend downward. Since these are 21-day moving averages, they won't roll over quickly. But, in the course of a retesting of the lows and then a move above the center point of the "W," that might be enough time for them to turn bullish -- much as they did in February.

Market breadth has been abysmal during this decline. In fact, it hasn't been good for a long time. However, breadth was so bad that is was oversold, and helped spur Thursday's rally.

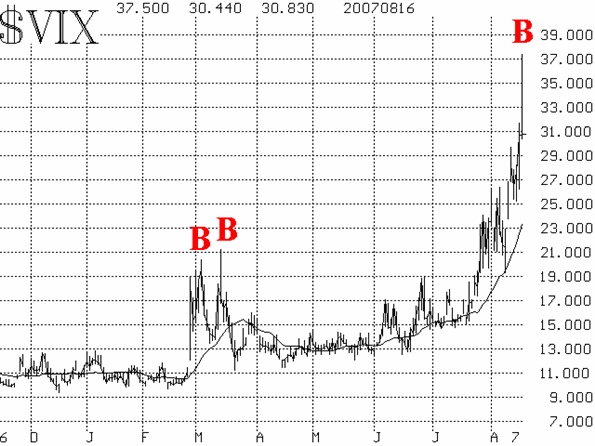
Volatility indices ($VIX and $VXO) shocked traders by exploding to levels not seen in nearly five years. This in itself is an oversold condition of sorts, since $VIX rushed up so far, so fast. A spike peak in $VIX is considered to be a buy signal, and none has been forthcoming -- until today. Today, $VIX rose to 37.50, and closed at 30.83. That, in my opinion, is a spike peak buy signal in volatility, but I suppose for completeness' sake, we'd like to see $VIX close lower tomorrow.

How far could a short-term rally carry? That is very difficult to say. The one last week was good for nearly 70 $SPX points. This one began at 1370 and has already carried 45 points. It is possible that $SPX could challenge the 1430-1440 area or slightly higher on this short-term move.
In summary, we think that a short-term, short-lived, oversold rally is under say. Once it runs its course -- in the next few days, at a much slower pace -- then $SPX should fall back below 1405 (the closing low so far) and perhaps all the way to 1370-1380 (the intraday lows). At that time, if our technical indicators are bullish -- or at least less negative that they were -- then there would be a positive divergence, which could lead to a lasting buy signal. But if that retest also fails, then a confirmed bear market will be in progress. Stay tuned.
Lawrence G. McMillan is the author of two best selling books on options, including Options as a Strategic Investment, recognized as essential resources for any serious option trader's library.
|