| Weekly Outlook in the Stock Market |
| By Price Headley |
Published
08/19/2007
|
Stocks
|
Unrated
|
|
|
|
Weekly Outlook in the Stock Market
NASDAQ Composite
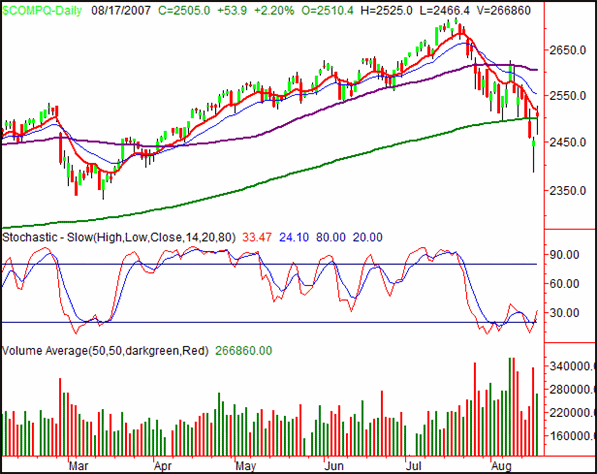
The NASDAQ's close of 2505.0 on Friday was 53.9 points better than Thursday's close -- a 2.2% improvement. For the week though, it still wasn't enough to pull things out of the red. The composite closed down 39.9 points from the previous week -- a loss of 1.57%. Despite the loss though, we like the bulls' chances here.
Let's go back to Thursday's bar -- the shape of it, specifically. The open and close are pretty much the same, yet we saw a deep low of 2386.70. The resulting shape is called a hammer. More importantly, these are often seen to be pivot points for an upside reversal. All the sellers are finally washed out in the middle of the day, then the buyers take over. Thus, the index is headed higher as the day comes to a close.
The confirmation for such a signal is follow-through the next day, which we certainly saw on Friday. In fact, the NASDAQ closed back above the 200-day line (green) -- a key long-term moving average.
All things considered, it's a good start to rebound, but we're far from out of the woods. From here, we're not even back above the 10-day moving average line. It's currently at 2518, and as you can see, has been a ceiling -- and not in a positive way -- for the index over the last week or so. So, that's one of our lines in the sand.
The ultra-safe bull/bear line may be the 50-day average (purple). The NASDAQ took a swing at it two weeks ago, but failed to breach it. It's at 2604 as of now.
NASDAQ Composite - Daily

S&P 500
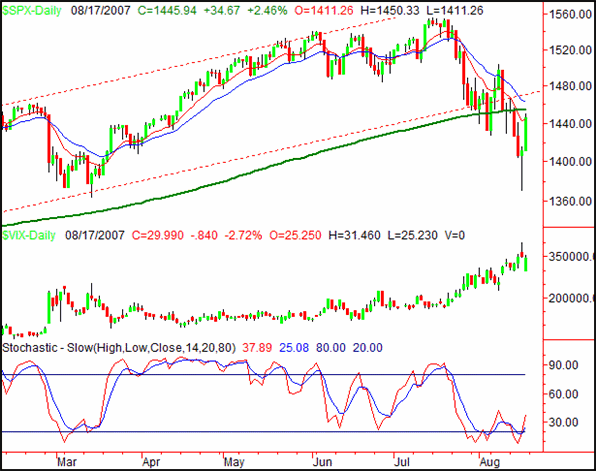
The S&P 500 regained 2.46% on Friday (+34.67 points) to end the session at 1445.94. That was still down for the week though -- 7.7 points under last Friday's close (-0.53%). However, we think the bulls will like the way the bars shaped up as the week came to close. The hammer and follow-through we mentioned for the NASDAQ? Ditto for the SPX.
The one thing that's different about the SPX's chart is that it didn't get back above the 200-day line. The S&P 500 also struggled with the 10-day average line at 1444. Needless to say, that's our first hurdle to get through before we can even think. We barely got above it Friday, and we need to see some significant follow-through. In fact, just to be safe, let's draw the final line in the sand at 1463, where the 20-day line (blue) currently lies.
The one thing you can see here (finally) is an easing VIX. Thursday appears to have been a peak in fear, largely showing us a mirror image of the market's equal reversal. Plus, having reached multi-year highs (and getting up there with rarely seen high levels), there's now a ton of room for the VIX to pull back. That's fuel in the market's tank.
So, while the overall effort last week was bullish, we don't want to jump the gun just yet. We got a big rebound move just two weeks ago, which forced a retest of the 20-day line. That surge faltered the very next day though, and we were sent on to new multi-week lows. Therefore, we remain cautiously optimistic. Getting past and staying above the 20-day average is the key to adding more long exposure (though there's nothing necessarily wrong with tip-toeing in already following Thursday's move - it could be worth a shot).
S&P 500 - Daily

Dow Jones Industrial Average
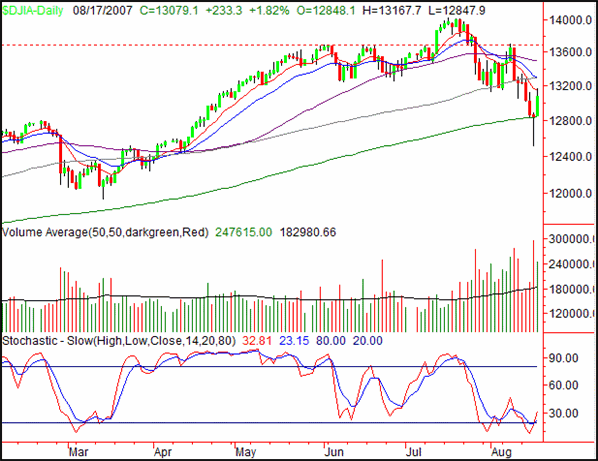
The Dow Jones Industrial Average was higher by 1.82%/233.3 points on Friday, ending the day at 13,079.1. Despite the big gain, the blue chip index still took a 1.21%/160.4 point loss on a weekly basis. Overall though, we'd say things ended on a bullish note.
Caught between a rock and a hard place. That may be the bets way to describe this chart. though it's not necessarily a good or bad thing. The rock is the 200-day line (green) which held up as support on a closing basis, though not on an intra-day basis. The hard place is the 10-day average line (red), which was a ceiling more than once last week. (Sound familiar?) Everything we said above about the moving average lines seems to apply here as well.
The safe play may just be to wait for a move back above 13,700 (dashed). That level has been resistance more than once lately. It's not like it's that far above where we are now.
Dow Jones Industrial Average - Daily

Price Headley is the founder and chief analyst of BigTrends.com.
|