| Corcoran Technical Trading Patterns for August 21 |
| By Clive Corcoran |
Published
08/21/2007
|
Stocks
|
Unrated
|
|
|
|
Corcoran Technical Trading Patterns for August 21
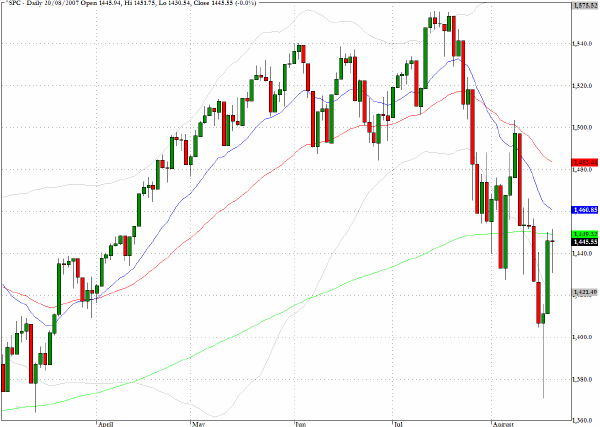
Yesterday's session provided another roller coaster ride for traders, but this was confined within a relatively narrow range. The S&P 500 (^SPC) concluded the session more or less where it had begun but directional uncertainty seemed to be the primary feature for all of the indices. As expected, after last week's selling pressures there is a tentative and cautious tone to the notion of pushing back above the hurdle presented by the 200-day EMA.
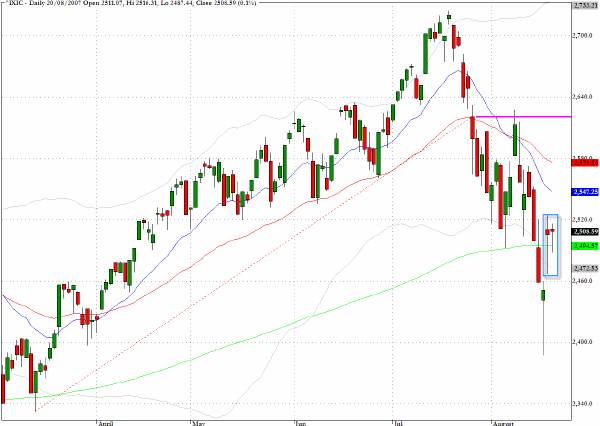
The chart for the Nasdaq Composite (^IXIC) shows that there are a series of hurdles faced by the index which has managed to remain mostly above the 200-day EMA. The real test for the bulls is the highest hurdle that has been drawn in around 2600 which is where the breakdown from the uptrend from the March lows took place.
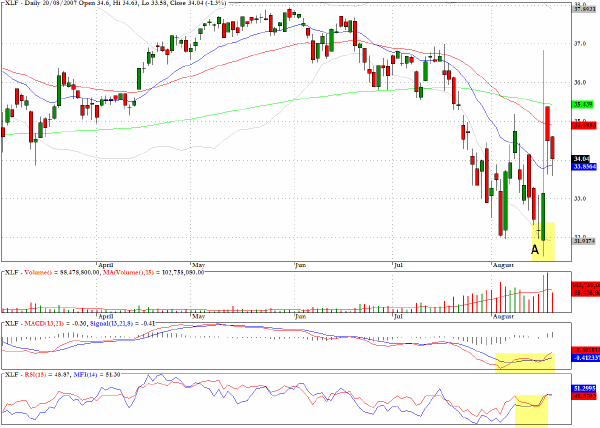
The exchange traded fund for the financial sector, XLF, has shown unusually heavy volume characteristics over the last month illustrating not only its usefulness as a tool for trading the sector but also for gauging what is happening, from a technical perspective, in the sector. The point A on the chart corresponds to last Thursday’s turnaround session and as the MACD and MFIC charts clearly reveal positive divergences were pointing to an imminent rebound in the fund which had been sold aggressively since breaking below the 200-day EMA in mid July.
The exact timing for trade entry when these kinds of divergences appear is far from exact but I have found them to be particularly reliable in my trading experiences.
TRADE OPPORTUNITIES/SETUPS FOR TUESDAY AUGUST 21, 2007
The patterns identified below should be considered as indicative of eventual price direction in forthcoming trading sessions. None of these setups should be seen as specifically opportune for the current trading session.
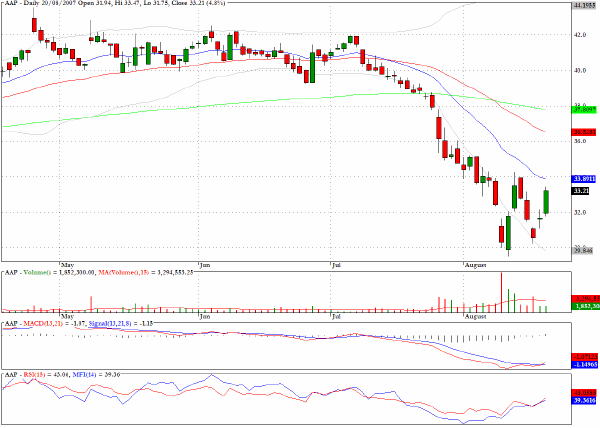
Yesterday's suggestion regarding Advance Auto Parts (AAP) worked out well as the stock gained almost five percent and provided an entry opportunity very close to Friday's close.
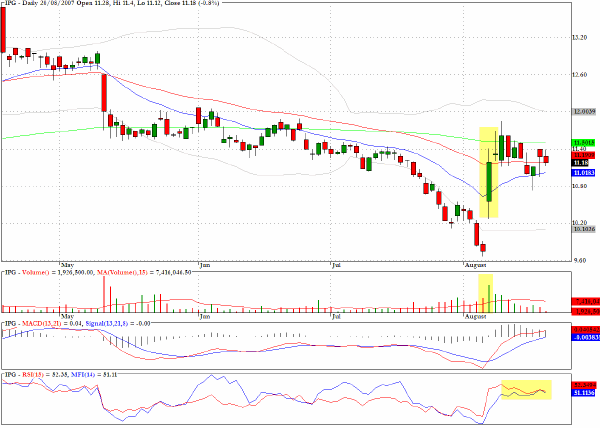
Interpublic (IPG) looks as though it is preparing to move above an area that represents a convergence of all three moving averages.
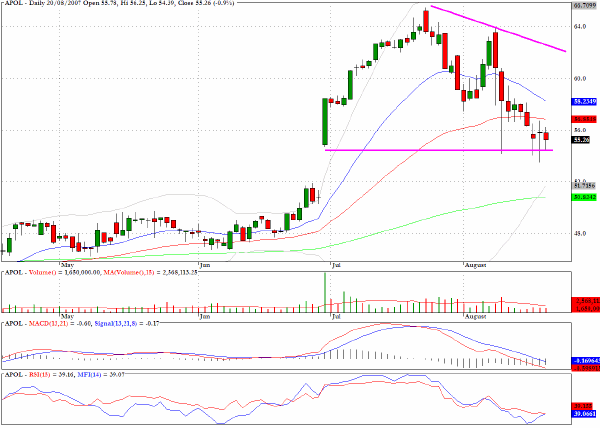
Apollo Group is hanging on, barely, within a descending wedge formation and looks vulnerable in the medium term to a fall below the point where it gapped up in late June.
Clive Corcoran is the publisher of TradeWithForm.com, which provides daily analysis and commentary on the US stock market. He specializes in market neutral investing and and is currently working on a book about the benefits of trading with long/short strategies, which is scheduled for publication later this year.
Disclaimer
The purpose of this article is to offer you the chance to review the trading methodology, risk reduction strategies and portfolio construction techniques described at tradewithform.com. There is no guarantee that the trading strategies advocated will be profitable. Moreover, there is a risk that following these strategies will lead to loss of capital. Past results are no guarantee of future results. Trading stocks and CFD's can yield large rewards, but also has large potential risks. Trading with leverage can be especially risky. You should be fully aware of the risks of trading in the capital markets. You are strongly advised not to trade with capital.
|