NASDAQ COMMENTARY
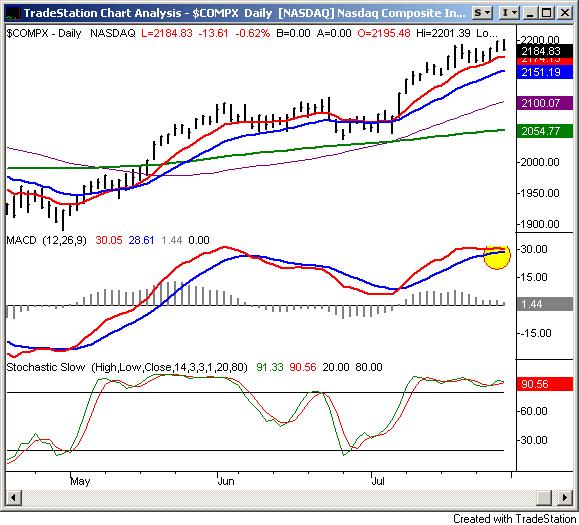
Friday got ugly, with the NASDAQ giving up 13.6 points (-0.6%). But it still needs to be kept in perspective. For the week, the NASDAQ composite still gained 5 points, closing out at 2184.83. So the question is, was Friday's action a red flag of what's to come? Or was it just the kind of pullback you see on a Friday after some profits are ready to be taken? In other words, is there anything different about this selling? Technically, speaking, not really. The composite is still trading above its 10 day line (2174.15), so from a momentum perspective, it's still way too early to say that trouble is looming. In fact, more often than not, you'd want to buy into stocks as they make new highs. The NASDAQ did just that, as Friday's high of 2201.39 represented a new multi-year high.....barely. This coming week is very much a 'make or break' pivot for the market. Any rally is likely to be huge (albeit unmerited), but it would also be a setup for a bigger pullback later this year. On the other hand, reaching the 2200 level again set off a concerning amount of selling. Throw in the fact that some momentum indications are telling us the bulls are done for now, and there are still some major concerns about how vulnerable we are right now. Let's take a look at the chart. (continued below)
On the chart, the 10 day average is traced in red. Looking back over the last three months, it's obvious that stocks were - and are - going higher. The recent weakness really hasn't even been weakness at all. Stocks deserve a break, and they still haven't had a good one on weeks. In that light, Friday's dip isn't a big surprise. The bigger concern is the fact that we're on the verge of a bearish MACD crossunder (highlighted in yellow). It hasn't happened yet, and it may not, but it looks like it will be tough to avoid. However, while the last MACD cross led to a small loss, it wasn't enough to unwind the overall market strength. It's doubtful that getting one now will be devastating either, but it certainly can put any bullish plans on hold for a few days.
So what's the bottom line for the NASDAQ? We have to stick with the current trend, and be bullish until we have a reason not to be. The beginning of a bearish move would start with a cross under the 10 day line. But even if we do get that, the furthest extent of any drop should be around 2100. That's where the 50 day average (purple) is right now. That would also be about a 4 percent drop - a typical correction. As we've been saying, we're bullish in the bigger picture no matter what happens next, so the dip would be a good chance to add to long-term positions. In the meantime, let's see how this week unfolds. The possible dip may end up being a moot point. (Be sure to read our bottom line below for the major vulnerability the uptrend is facing right now.)
NASDAQ COMPOSITE CHART - Daily

S&P 500 COMMENTARY
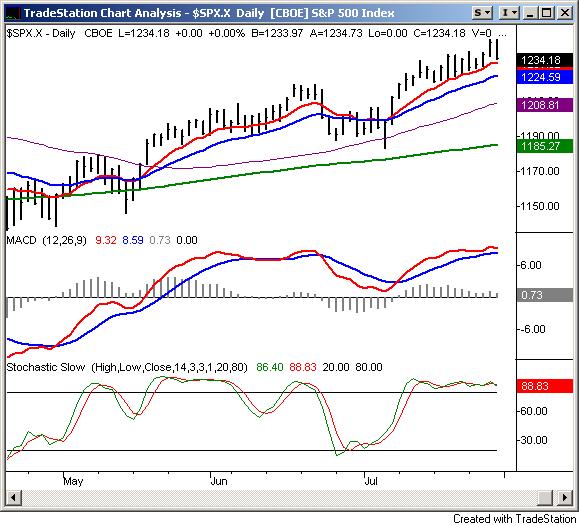
The S&P 500's story is about the same as the NASDAQ's. The bigger trend is still bullish, but Friday looked like it could signal a little trouble. Unlike the NASDAQ, the SPX didn't hit a new high on Friday. The most recent high of 1245.15 was hit Thursday, and all those gains were more than given back on Friday. For the week, though, the large cap index closed about a point.
What's different about the S&P 500 chart is just what a big drop we saw on Friday. That dip was enough to get the index back to 1234.18 - just a hair above 1231.82, where the 10 day line is. So like the NASDAQ, a lot is riding on what happens when we finally hit the 10 day average. Will it be support, or will the sellers drive the index right under it. As of right now, we have to stay bullish, sticking with the traditional 'the trend is your friend' lesson. On the other hand, if there was ever an index on the verge of at least a small breakdown, this is it. We've been stochastically overbought for a while, and the weight of that is really starting to weigh in on things. Like the NASDAQ, the SPX is on the verge of a bearish MACD cross. But, until we see these technical signals fall into place, we're not going to move completely to the bearish camp.
Besides the possible support at 1231, the worst case scenario would be a dip to 1208. That's where the 50 day line is right now, and would be only a minor selloff in the grand scheme of things. Again, it would be a buying opportunity.
S&P 500 CHART - Daily

BOTTOM LINE
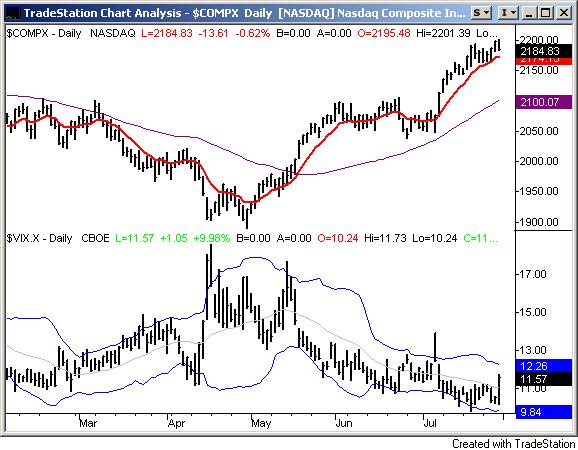
Our views were a little mixed above, so we'd like to illustrate why we're hesitant to buy into the recent strength (like we normally would). We occasionally talk about the VIX - the fear gauge - as a way to spot potential reversals. For those who don't follow it on a regular basis, it' been lingering at uncanny lows recently and actually putting together a string of new lows). Historically, that's a signal that a correction is on the way, but so far, we hadn't seen any hints that the bulls were going to quit. That is, until Friday. While the market only saw a mild pullback then, the VIX made a hue move up an off those recent lows. The strength of that bounce, especially after hitting record lows, has to force us to ask the question of whether or not it's finally time to pay the piper. It's still too soon to say, but it was a very firm VIX rally. We'll keep a close eye on this in the coming days. And quite frankly, it would be healthier for the long-term bull market if the VIX made a big move higher. Long-term rallies just don't start with the VIX at long-term lows. We need to bleed off some of this confidence. In the meantime, a rising VIX will probably coincide with falling stocks, although it wouldn't have to be a catastrophic selloff.
S&P 500 with VIX - Daily

Price Headley is the founder and chief analyst of BigTrends.com.