| Corcoran Technical Trading Patterns for August 23 |
| By Clive Corcoran |
Published
08/23/2007
|
Stocks
|
Unrated
|
|
|
|
Corcoran Technical Trading Patterns for August 23
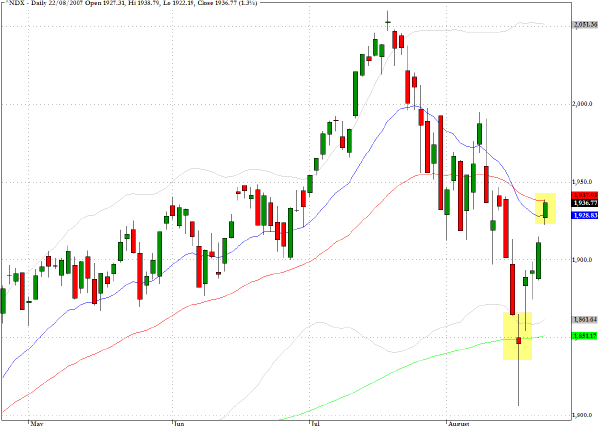
Many charts are revealing how much recent price patterns have been guided by two key technical indicators - the 50-day exponential moving average and the 200-day EMA. For example the daily chart for the Nasdaq 100 (^NDX) clearly illustrates how the 200-day EMA uncannily provided support during last week’s rout and how the fifty day EMA has been targeted for the recovery rally.
In yesterday’s trading the index came to rest at almost exactly the level for the 50-day EMA. There is a further hurdle to be crossed which is chart resistance/support at 1950 which sits less than one percent above yesterday’s close. My suspicion is that we may see a spike above that level in today’s trading but there will be difficulty in sustaining closes above that level without some price consolidation and digestion of the recent gains.
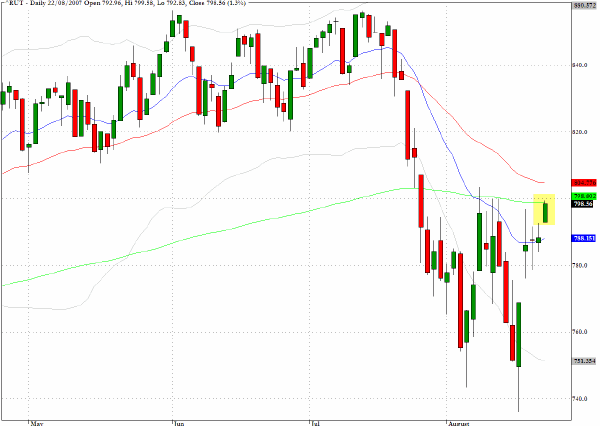
Echoing the observation that recent price action has validated the reliance on the two key EMA indicators, the Russell 2000 (^RUT) came to rest in yesterday’s recovery continuation almost exactly at the level of the 200-day EMA. The index faces not only the resistance provided by this key moving average but there is a chart based hurdle at the 800 level.
It would be surprising to see this index surge through this overhead resistance but, having said that, I am learning, in the current exceptional market conditions, to become quite relaxed about surprises.
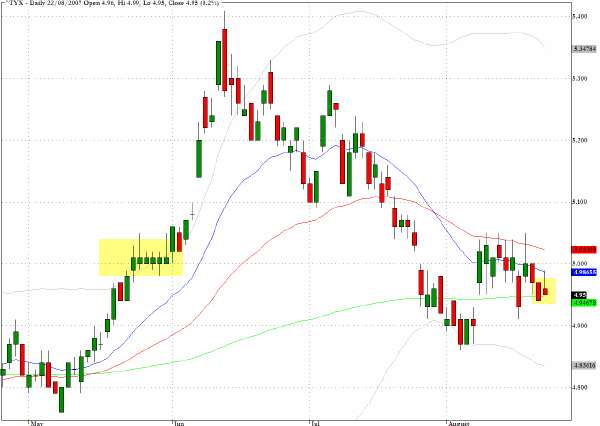
Treasury yields especially of shorter duration securities have plunged over the last month as the flight to safety issues have become intermingled with speculation that short term rates are headed down. Also quite notable has been a steepening of the yield curve at the longer end and highlighting this, the 30 year bond closed yesterday at a yield of more than thirty basis points above the ten year note’s yield.
Despite erratic moves at the shorter end of the duration spectrum, the yield on this longest dated Treasury, currently close to five percent and the 200 day EMA, has been relatively stable during August.
TRADE OPPORTUNITIES/SETUPS FOR THURSDAY AUGUST 23, 2007
The patterns identified below should be considered as indicative of eventual price direction in forthcoming trading sessions. None of these setups should be seen as specifically opportune for the current trading session.
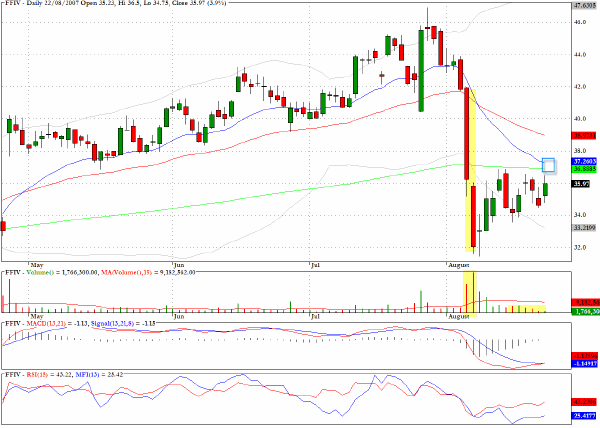
F5 Networks (FFIV) continues to exhibit the characteristics of a bear flag formation and the pattern looks to be ripening as the volume on yesterday’s move up towards the 200-day EMA was on very subdued volume.
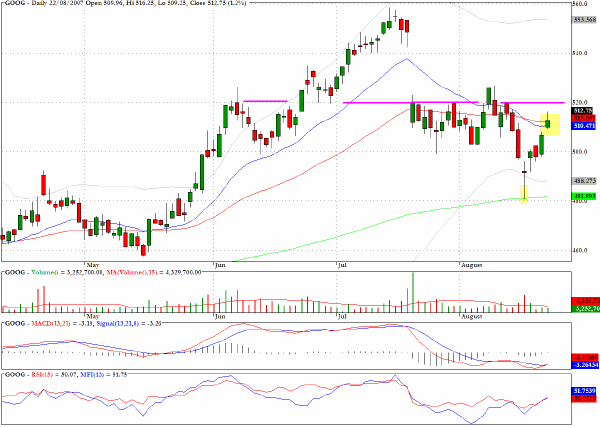
Reinforcing the theme developed earlier regarding the two key moving averages, Google (GOOG) once again illustrates how the 200 day EMA provided intraday support during last week’s sell off and yesterday’s close yet again was exactly at the 50 day EMA. The stock also faces chart resistance at $520.
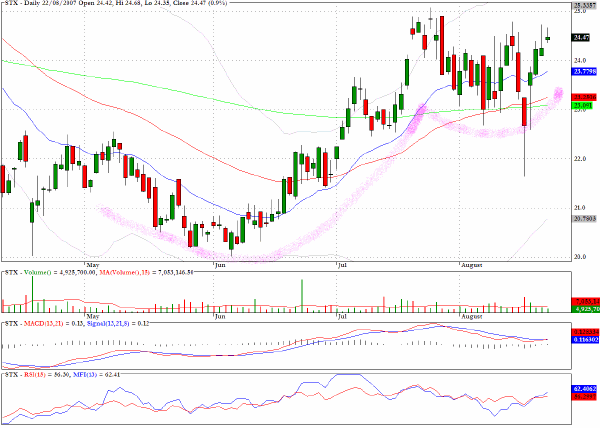
One chart to keep an eye on for a possible bullish breakout in the medium term is for Seagate Technology (STX). A move above $25 on substantial volume could put the previous 2007 highs close to $28 back in play.
Clive Corcoran is the publisher of TradeWithForm.com, which provides daily analysis and commentary on the US stock market. He specializes in market neutral investing and and is currently working on a book about the benefits of trading with long/short strategies, which is scheduled for publication later this year.
Disclaimer
The purpose of this article is to offer you the chance to review the trading methodology, risk reduction strategies and portfolio construction techniques described at tradewithform.com. There is no guarantee that the trading strategies advocated will be profitable. Moreover, there is a risk that following these strategies will lead to loss of capital. Past results are no guarantee of future results. Trading stocks and CFD's can yield large rewards, but also has large potential risks. Trading with leverage can be especially risky. You should be fully aware of the risks of trading in the capital markets. You are strongly advised not to trade with capital.
|