| Corcoran Technical Trading Patterns for August 24 |
| By Clive Corcoran |
Published
08/24/2007
|
Stocks
|
Unrated
|
|
|
|
Corcoran Technical Trading Patterns for August 24
Option writers were extravagantly rewarded during the recent periods of exceptional volatility and put buyers paid large premiums for their protection but the markets now appear to be settling down to a calmer, less turbulent trading conditions. As if to underline the point the DJIA finished the session within a point of its previous close and similar small changes were seen in the other indices including the UK’s FTSE.
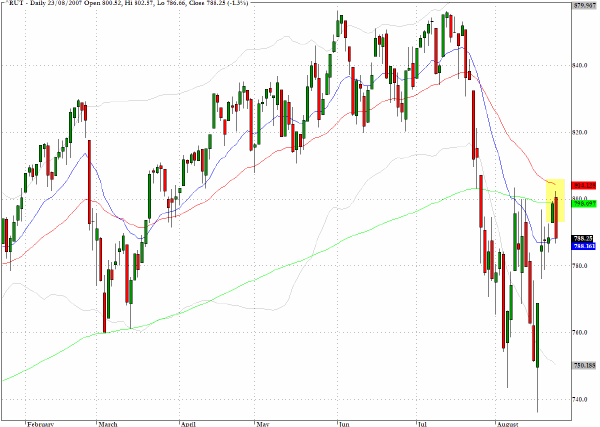
The largest move was seen in the Russell 2000 (^RUT) which, as discussed in yesterday’s column, encountered resistance at the 800 level and the 200 day-EMA and fell back by 1.3%. As we move into a week of late summer public holidays (Monday is a holiday in the UK and the following Monday is Labour Day in the US) it is likely that, if the relative calm can be prolonged and traders have increased confidence, they can leave their desks for the beach, and the markets may enter a period of consolidation.
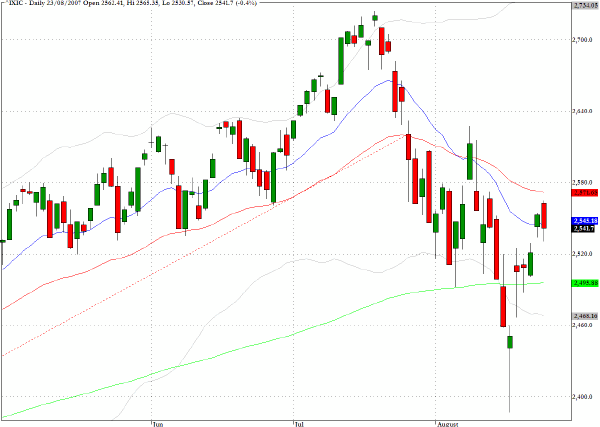
The Nasdaq Composite (^IXIC) has also entered a zone, between the 200-day EMA below and the 50-day EMA above, where some consolidation and price congestion may appear.
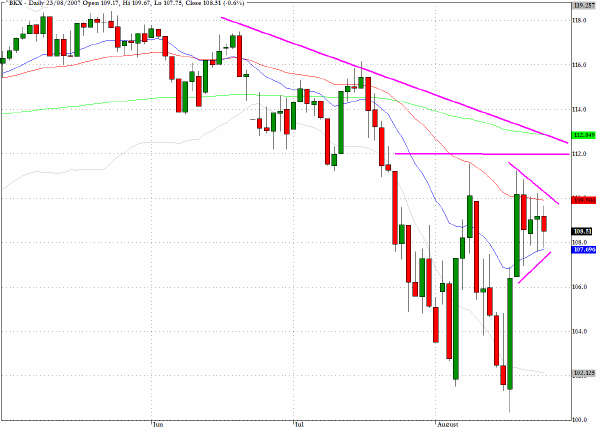
The banking index (^BKX) is forming a triangular formation as it faces a quite well defined chart hurdle above current prices. As the chart annotations suggest, the 112 level will provide a real test for those who believe that the recent credit market woes have been largely discounted, and that with a more accommodative Federal Reserve, the backdrop to the financial economy is improving.
Certainly there have been some notable moves in the sector, and Wells Fargo (WFC) appears to be in the process of forming a bullish flag just after pulling back from its recent historic high.
TRADE OPPORTUNITIES/SETUPS FOR FRIDAY AUGUST 24, 2007
The patterns identified below should be considered as indicative of eventual price direction in forthcoming trading sessions. None of these setups should be seen as specifically opportune for the current trading session.
A lot of the focus at present is on the stamina of the consumer sector. Consumer demand represents almost two thirds of US economic activity and consumers have hitherto proven remarkably resilient during periods of relative adversity. Analysts will, even more feverishly than ususal, be monitoring all vital signs to see whether consumers are going to retain their acquisitive appetites in the coming months or whether the housing downturn and decreased availability of easy credit is going to lead to a significant slowdown.
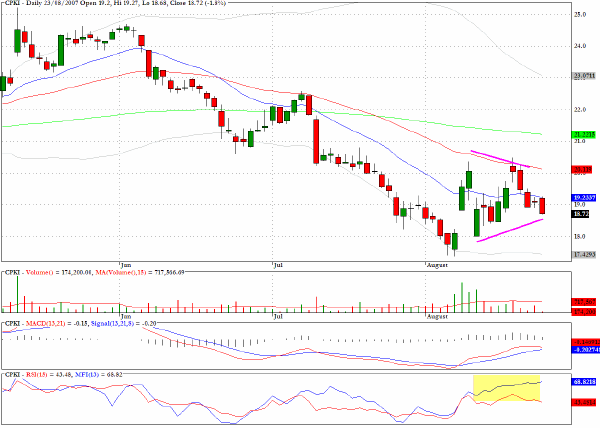
Retailing and consumer discretionary stocks are revealing some of the more interesting patterns. California Pizza Kitchen (CPKI) moved down steadily throughout June and July but now appears to be in a basing pattern with signs of accumulation. The 50-day EMA (red line) corresponds quite closely to a declining trend line through the highs and the stock will need to take on this hurdle before it can turn positively bullish but the momentum appears to have transitioned noticeably from the previous negative tone.
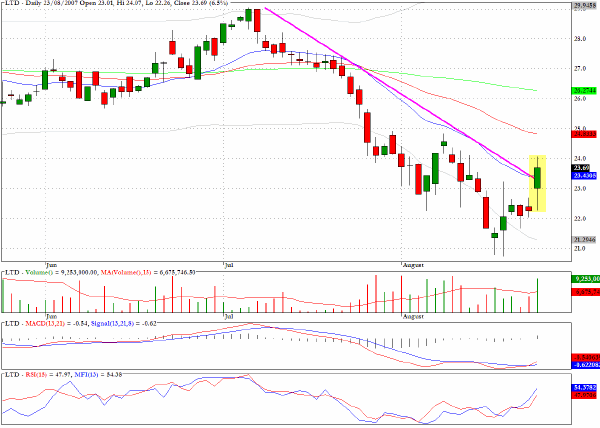
Limited Brands (LTD) has a similar downward trendline to CPKI, but this time it follows the 20-day EMA (blue line). The stock peeked above this line yesterday and once again the money flow dynamics have turned positive.
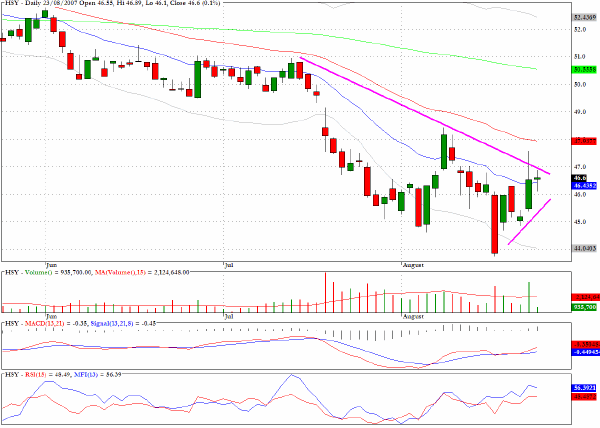
Another stock that faces a similar down trend hurdle is Hershey (HSY). The main reservation preventing me from getting too enthusiastic about this stock is the monthly chart which looks distinctly bearish, and it would seem that any upward progress in the short term will run into strong head winds in the longer term.
Clive Corcoran is the publisher of TradeWithForm.com, which provides daily analysis and commentary on the US stock market. He specializes in market neutral investing and and is currently working on a book about the benefits of trading with long/short strategies, which is scheduled for publication later this year.
Disclaimer
The purpose of this article is to offer you the chance to review the trading methodology, risk reduction strategies and portfolio construction techniques described at tradewithform.com. There is no guarantee that the trading strategies advocated will be profitable. Moreover, there is a risk that following these strategies will lead to loss of capital. Past results are no guarantee of future results. Trading stocks and CFD's can yield large rewards, but also has large potential risks. Trading with leverage can be especially risky. You should be fully aware of the risks of trading in the capital markets. You are strongly advised not to trade with capital.
|