| The McMillan Options Strategist Weekly |
| By Lawrence G. McMillan |
Published
08/24/2007
|
Options
|
Unrated
|
|
|
|
The McMillan Options Strategist Weekly
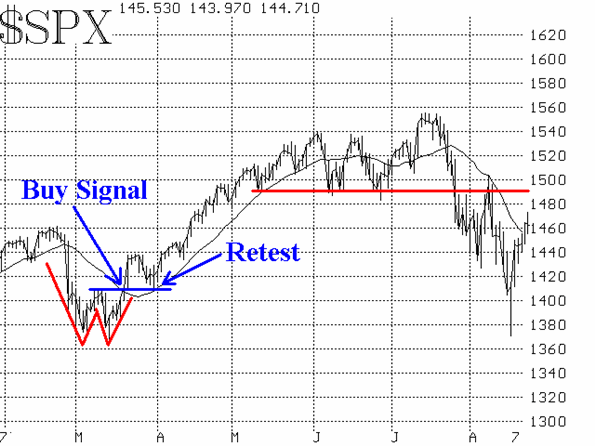
The rally that began with the monstrous intraday reversal last Thursday, August 16, continues to run its course. Our inclination is that this rally will shortly diminish and a retest of the lows will take place. There seems to be a lot of people looking for a retest -- a fact which one knowledgeable observer cited, while noting that the stock market rarely accommodates the majority. So perhaps, there will not be a retest right away, or even at all. It really doesn't matter a lot, for we don't like trying to pick the exact bottom anyway, but instead would rather wait for a confirmed upside breakout before turning bullish. That requirement keeps one from buying into a continuing downtrend, should one develop.

$SPX has only just barely closed above its (still declining) 20-day moving average, so the rally has not been spectacular, at least in terms of that measure. Perma- bulls on TV, of course, continue to think the bottom is in, merely because $SPX has rallied X points off its low. That is rarely what determines a bottom. There is overhead resistance at 1490-1500 on the $SPX chart, and it could prove formidable, too.

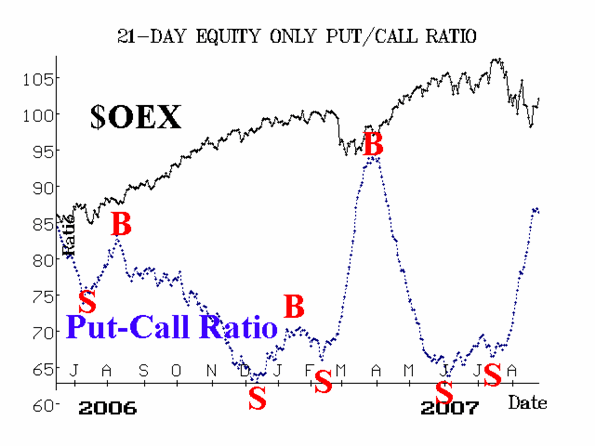
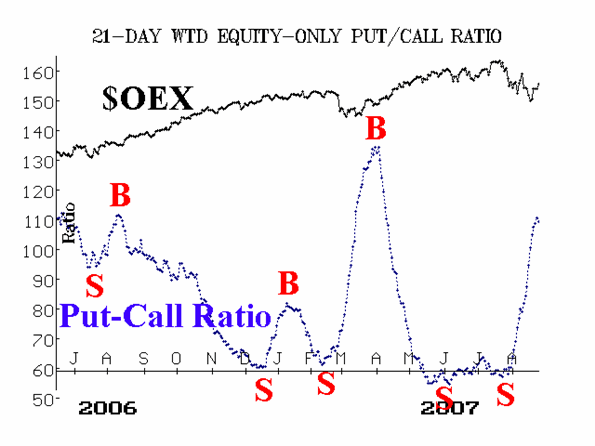
The equity-only put-call ratios (Figures 2 & 3) continue to remain on sell signals. That will be the status quo as long as they continue to rise. Eventually, they will roll over and begin to decline, at which point we'll have buy signals, but that doesn't appear to be on the near-term horizon.

Market breadth has improved a lot in the last week. The oversold conditions that precipitated the bottom are no longer in place.
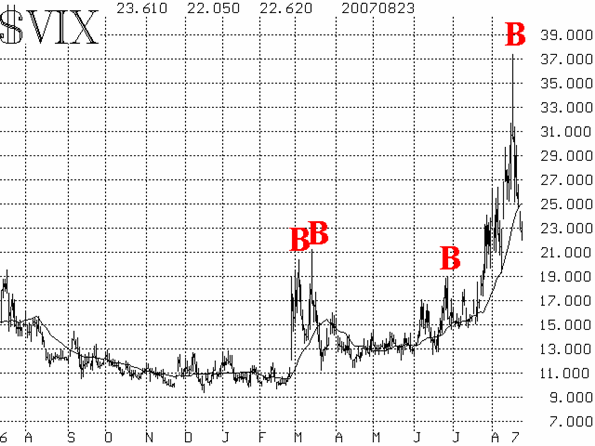
Finally, the volatility indices ($VIX and $VXO) are strongly on buy signals, as they formed large spike peaks on their charts and have declined well below their recent peaks.

So, we have buy signals from volatility and breadth, while the longer-term indicators (put-call ratios and the $SPX chart) are not bullish yet. We continue to think that a "W" bottom will form. Regardless, it is upside breakouts over significant resistance levels that determine whether a bottom is in -- it is just easier to spot that if a "W" has been formed first.
Lawrence G. McMillan is the author of two best selling books on options, including Options as a Strategic Investment, recognized as essential resources for any serious option trader's library.
|