| Weekly Outlook in the Stock Market |
| By Price Headley |
Published
08/26/2007
|
Stocks
|
Unrated
|
|
|
|
Weekly Outlook in the Stock Market
It was a very strong week for the markets, as stocks recovered in the wake of the prior several weeks' correction. New home sales for July came in stronger than expected, sparking some newfound buying in the beaten-up housing stocks. So where do the markets go next? Let's take a look at the big three market indexes.
NASDAQ Composite Commentary
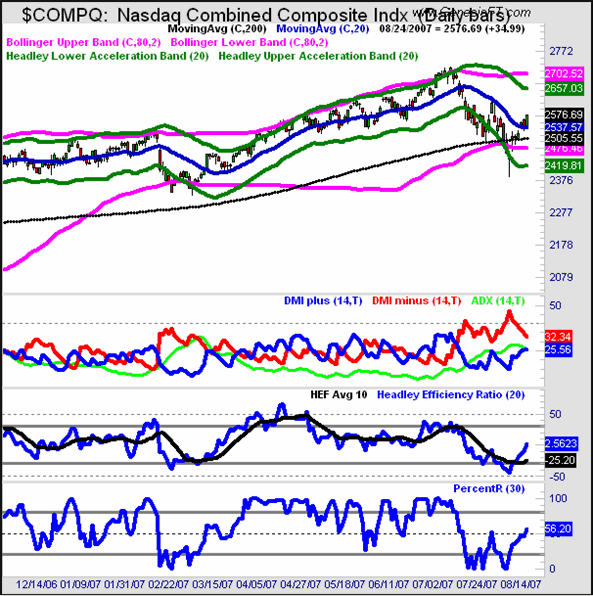
For the week, the Nasdaq Composite gained 125 points to close at 2576.69. This massive upside leadership by the Nasdaq relative to the other major indexes is a bullish sign, as it shows us that portfolio managers are still interested in pushing this more aggressive growth index higher with continued incoming money flows. The 80-day Bollinger Bands (in pink) have marked the relative highs and lows for the Nasdaq Composite quite well, and the prior week's blow-off on the downside looks like a major bottom. Plus the 200-day moving average (in black continues to hold). The underlying indicators like ADX and Percent R are still more bearish than bullish in the near term, while the Efficienecy Ratio has turned up above its 10-day average. In a nutshell, we're longer-term bullish while looking for a potential retest near the 2500 level to mark the next good buying area for new money.
NASDAQ Composite Chart - Daily

S&P 500 Commentary
The S&P 500 gained 34 points for the week to close at 1479.37. The index also retook its 200-day moving average line (in black), which is an encouraging sign for the longer-term uptrend to remain intact. There's still some overhead resistance to deal with near 1490 (dotted line), as this area was support back in May and June, and then this resistance held on the last test up in early August. We're expecting 1490 will be a short-term cap while any retest lower should hold up around the 200-day at 1456 and now lower than the lower 80-day Bollinger Band in the 1435-1440 zone. The Directional Movement (DMI) lines are still more bearish than bullish, so we think the market will next a few weeks to base before the bull market really gets going again more strongly. Plus September is historicaly the weakest seasonal month of the year, so don't be surprised to see some volatile trading range behavior before the bigger upside in the fourth quarter.
S&P 500 Chart - Daily

Dow Jones Industrial Average Commentary
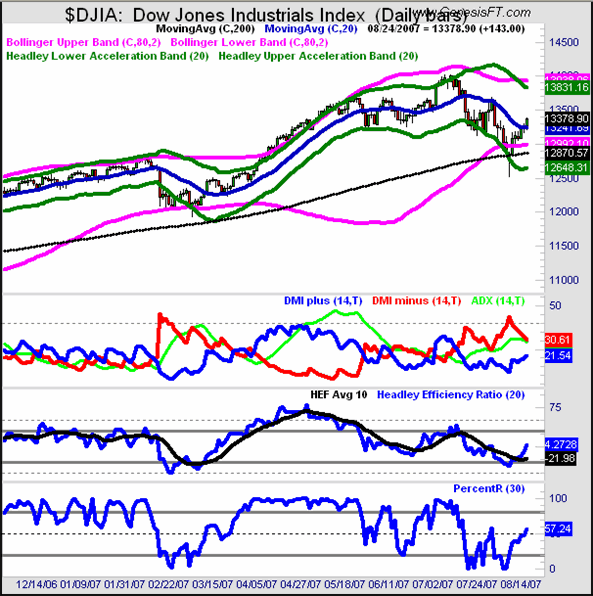
The 300 point gain in the Dow brough the index back convincingly over the 13,000 level to close at 13,378.90. The Dow held its 200-day moving average (in black) perfectly on the correction the prior week, and we expect the Dow to begin a slow but steady mark back to new highs before the year is out. Indicators say the Dow should find some resistance at the 13,500 area, while the 13,000 level is now shaping up as support. Our expectation is for an eventual move back to 14,000 and when that is taken out we should finish the year very strongly near 14,800 in our opinion. Patience will be the key for the next several weeks, but you want to be ready to buy dips within this bottoming process.
Dow Jones Industrial Average Chart - Daily

Price Headley is the founder and chief analyst of BigTrends.com.
|