We've been talking about it at length recently, but really haven't seen any significant change......that is, until now. What we're referring to is the CBOE Volatility Index (or VIX). It was (and is) a hot topic right now, primarily because it's been digging deeper and deeper into new lows. Historically, a very low reading for the VIX was a signal that confidence and complacency had set in, and that a correction was on the way. But for the last two months, that hasn't happened. Instead of the VIX bouncing up off of low levels and stocks selling off, the VIX has been inching lower, and stocks have been inching higher. We knew we'd eventually have to pay the piper, but the question was one of when. Well, after Monday, we might be one step closer to knowing. We'll look at that in a second. First, we'd like to answer a related question (actually, two related questions).
Question: (1) What constitutes the VIX? I guess in an ideal market, a buy point is when the VIX starts to trend lower.......? (2) We seem to be in an era of low VIX readings that most commentators attribute to general investor complacency, but my understanding of the VIX indicator is that it reflects the price of options, so wouldn't one expect to see a low VIX in an environment of low interest rates and low yields everywhere?
Answer: We wanted to address both questions simultaneously, as one answer leads into the other. Like it sounds, the VIX is CBOE's measure of how volatile the stock market is supposed to be over the next 30 days. How is this done? The Chicago Board of Option Exchange calculates the type and degree of market movement that investors expect based on put and call option price data for the stocks that make up the S&P 500 (that's part of the answer to question number 1). A relatively high VIX is supposed to foreshadow high volatility, while a low VIX readings sets the stage for smooth sailing. So in the second question, the statement is right - the VIX reading is based on option prices.
So what does the high or low VIX reading have to do with the market's direction? Remember - the CBOE's original intent for the VIX was only as a predictor of volatility. The 'fear-gauge' aspect wasn't part of the original plan - it just worked out that way. Theoretically (and here's the answer to question number 2), a high VIX can mean bullish volatility is in the works, or bearish volatility is on the way. In reality, investors don't respond to bearish expectations in the same way they respond to bullish expectations. A situation that might prompt the purchase of bearish put options may not necessarily lead to the purchase of bullish call options when the situation is perfectly reversed. In a bull market, folks are apt to buy calls, In a bear market, folks are apt to not buy puts or calls, opting to do nothing instead. This is why the VIX ended up working out so well as a fear gauge, even though that wasn't the original purpose......because a falling market is not a perfect mirror image of a rising market. It wasn't until after the VIX calculations began that the common interpretation for the VIX began - as a fear gauge. A high VIX came to be associated with a lot of investor fear, which contrarians have accurately seen as bullish for stocks. Conversely, a low VIX is associated a high degree of investor confidence, which often comes as market tops. Investors behave differently as the two types of markets progress, which is why the VIX behaves differently as well.
To address the second part of the second question, yes, we are in a period of general investor complacency, and no, it hasn't been disastrous yet (although we do think these recent low readings will lead to at least some weakness eventually). Yes, logically you'd expect to see a low VIX when interest rates are low. But that's the catch - you can't apply the obvious logic when fear and greed are at work.....fear and greed are not logical. The market is not the economy, and even though investors may say they assess the economy to buy or sell the market, they don't.....nor should they. We've seen time and time again that economic situations have either no effect (or the opposite effect) on where stocks go next. So for us, no, we don't associate the VIX with the current interest rates, or any interest rates.
So now that we know what the VIX and how it works, let's look at why we may finally be poised for a rally in the VIX, and a possible decline for stocks.
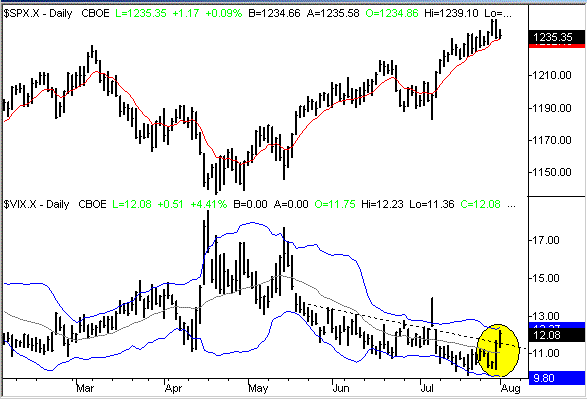
As for just how bearish any VIX-based pullback might be, the answer is 'not very'. But first, a quick description of why we could see a couple of days of weakness, as the VIX gets back to more tolerable levels. The VIX finally broke through a minor resistance line (dashed), and is now pressing into the upper Bollinger Band. This constitutes a pretty big change for the VIX. In fact, this is the strongest surge we've seen here since April. Add in the fact that stocks and indexes don't like to stay in one place too long, and you have a lot of pressure mounting for the VIX to move higher, and stocks to move lower. The thing is, this doesn't have to be a major correction. The VIX rally in April only lasted three days, but stocks fell more that just a little. The VIX's move to above 18, though, was what setup a major rally. Now with the VIX on the rise again, it could be enough to clean out any investors or traders who are on the fence, and unleash another move higher. We just need to pull back enough to do that. As of right now, the VIX says it could already be underway.
S&P 500 versus VIX - Daily

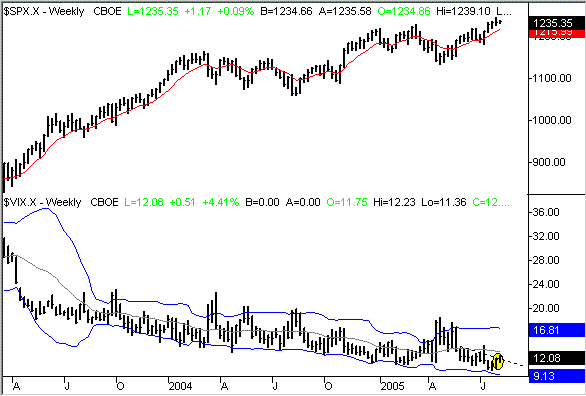
So how bad might any dip be? It shouldn't be major. April's wasn't. We just need to see the VIX get closer to 20 than the current level of 12. After that, the uptrend can resume. This trend is much easier to see on a weekly chart (below). Although the short-term could get a little rocky, it's clear that stocks are still in an uptrend, and the VIX is still in a downtrend. Like we've been saying, any dip is a long-term buying opportunity, but we're still due for such a dip.
S&P 500 versus VIX - Weekly

So will we get that selloff now, or later? I'd say wait and see how things pan out Tuesday. If we get another big rally in the VIX, that will pretty much be enough to prevent a quick resumption of the downtrend. At the same time, another loss for stocks could be enough to break the short-term bull run. As always, keep it all in perspective.
Price Headley is the founder and chief analyst of BigTrends.com.