| Water Water Everywhere |
| By Price Headley |
Published
08/31/2007
|
Stocks
|
Unrated
|
|
|
|
Water Water Everywhere
It seems like we continue to come back to this theme, but maybe there's a clue in that fact. Plain and simple, water has been a great investment lately. Since the beginning of the year, the Dow Jones Water Index (DJUSWU) is up 17.4% - and that's mostly utility companies in the index. Moreover, it easily tops the market's results.
While we certainly appreciate a good utility name, the non-utility water-centered companies appear to be offering even more of an opportunity. Some pieces of the industry itself is still in its infancy, and could experience many growth spurts over the coming years These companies are focused on things like water infrastructure and purification.
The challenge thus far has been finding a way to capitalize on the growth within those two industries, even though we think the utilities portion of this arena could continue to do well in the future.
As far as trading the infrastructure/purification theme goes, we'll closely examine two charts that have equivalent underlying instruments - the ISE Water Index (HHO), and the PowerShares Water Resources ETF (PHO).
The ISE index isn't tradable, and the options trading around the index have basically no volume. So, if you're looking to take action, you'll have a hard time doing it here. However, we feel it's an outstanding index and a great proxy. So, we're inclined to look at it in depth.
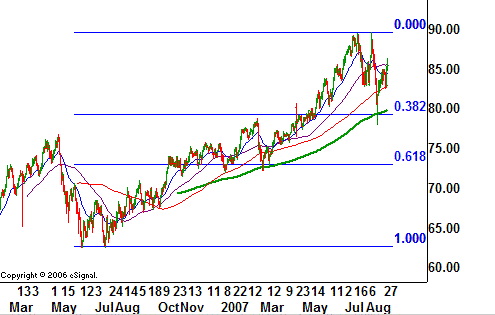
Though it's only been around for a few months, the trends for the ISE Water index are clear. The 200-day line (green) was support in March, and then again on August 16. The 10-, 20-, and 50-day lines have also all been support at one time.
ISE Water Index (HHO) - Daily

You can also see that the dip on the 16th pretty much brushed that first Fibonacci retracement level (38.2%), and inspired a rebound there....something most broad indices can't claim for themselves. Just for perspective, HHO is up 9.3% from the 16ths low. The S&P 500 is only up 6.3% from its low the same day. Plus, the chart of HHO just shows much more momentum, versus shakiness for most other charts.
The PowerShares Water Resources ETF (PHO) is much more user friendly, as it trades as an ETF but also offers options - though still thinly.
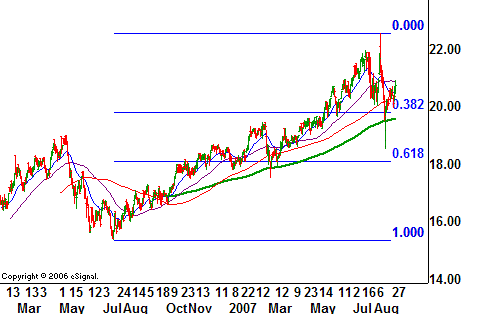
Though tradable, the issue here is obvious - volatility. PHO peaked at 22.56 on the 9th, and bottomed at 18.56 on the 16th....a 17% swing. Granted, unusual circumstances caused it, but it could still happen again.
PowerShares Water Resources ETF (PHO)

This chart closely resembles HHO's, and our take is basically the same.
As for targets and stops, we want to focus only on the ISE Index; you can extrapolate (if you want) to apply the same basic levels for the ETF.
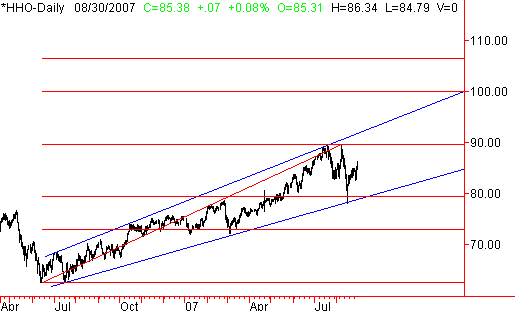
To find a decent stopping point for the uptrend, we've got two possible choices - Fibonacci extension lines (red), and the generally bullish channel (framed) in blue. The 89.66 level is where HHO peaked twice in recent weeks. Assuming we get past that first milestone, the next ceiling would come right at 100.0. That would be a pretty nice 15-point move.
However, the upper edge of the bullish zone may slow things down before that happens - anywhere from 91 to 100. Since it's rising, where we start to hit a headwind is as much an issue of time as it is place. Needless to say, that makes for a moving target.
The irony is, the more better-controlled the pace is, the higher the index is likely to go.
As for a stop, we'll use the 200-day line as the uncle point. It's at 79.78 right now, but creeps a little higher every day.
ISE Water Index (HHO) - Daily

By the way, if you're looking for specific companies as an alternative way to get involved in the sector, we suggest trying the ISE's info sheet on the holdings that make up their index. You'll see everything from NYSE-listed stocks to pink sheet ADRs.
Price Headley is the founder and chief analyst of BigTrends.com.
|