| Weekly Outlook in the Stock Market |
| By Price Headley |
Published
09/3/2007
|
Stocks
|
Unrated
|
|
|
|
Weekly Outlook in the Stock Market
You just can't keep a resilient market down.....for the most part. Some indices closed in the red for the week, while some of them managed to pull out a gain. All of them, though, were fighting back hard on Friday - right before a three-day weekend. That added non-trading day adds another day of 'I can't get out if I wanted to' risk, but the market didn't seem to care.
NASDAQ Composite
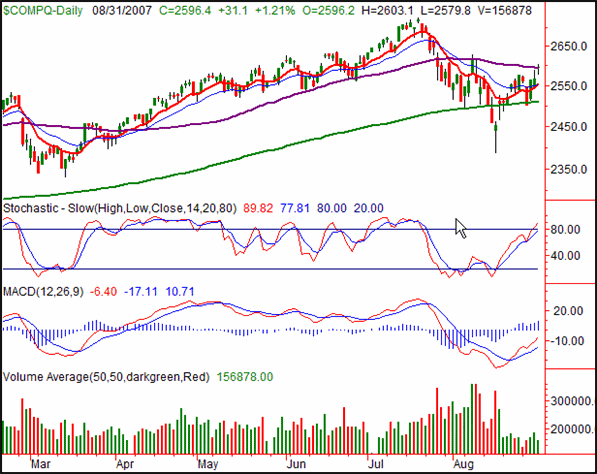
The 31.1 point gain on Friday for the NASDAQ - a 1.21% rally - left it at 2596.4 by the closing bell. That was enough to leave it in the black for the week, by 19.7 points (+0.76%). Impressive? Sure, we think so. However, there's just a little more work to go before the risk of a pullback is mostly abated.
What's bullish? A lot, actually. For starters let's start with the obvious - after the long-tail reversal from the 16th, we are visibly moving higher. The 10 day line (red) is finally back above the 20 day line (blue) for the first time in over a month, and we have a MACD divergence.
On the flipside, take a look where the advance was halted on Friday - right at the 50-day line (purple). Go back about three weeks to see where that rally was halted - right at the 50-day line. Perhaps it's nothing, but we'd like to see a close above it to really act as a good confirmation.
Will it happen Tuesday? It could, or maybe later in the week. Either way though, there's a little too much white space between where we are now and the 10- and 20-day lines. We could see one more retest of both of those lines (they're basically in the same spot) before getting that last good push. In fact, we hope we get it sooner than later.
So, the 50-day line at 2594 is the line to watch. Unless the index falls under the 10/20 day lines at 2553, we won't expect bearishness.
NASDAQ Composite Chart - Daily

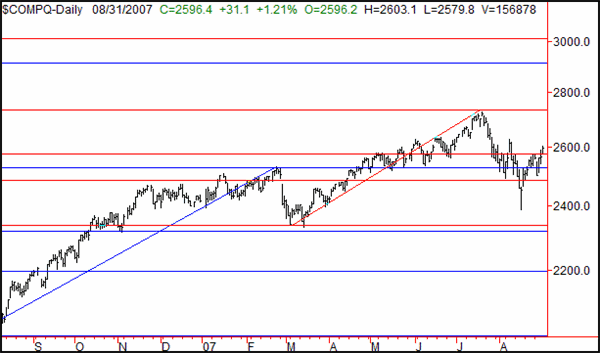
As for a potential upside target, there are two potential Fibonacci lines that may act as a ceiling. On the chart below, one is blue (based on the rally from June of late year through March of this year) and the other is red (based on the rally from March through July of this year). Their respective extension lines are at 2913 and 3011.
NASDAQ Composite Chart - Daily, with Fibonacci lines

S&P 500 Commentary
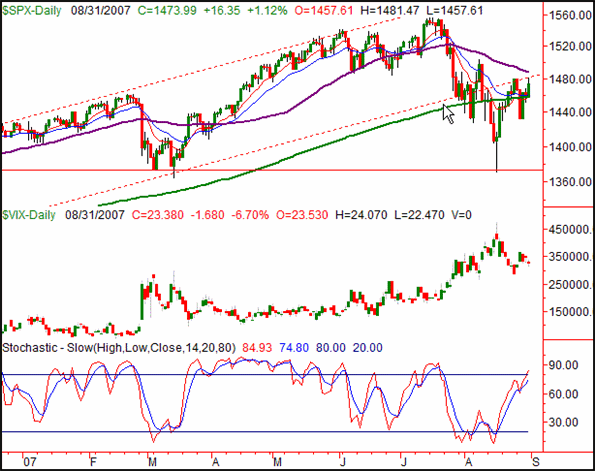
The S&P 500's 1.12% gain on Friday wasn't enough to stave off the weekly loss of 0.36%. It wasn't even enough to get the index back above its 50-day moving average line (purple). It was, however, enough to take care of a lot of other things the bulls have been waiting on.
As you can see, the SPX closed above its 10-, 20-, and 200-day lines for the week. And, the VIX was generally pointed lower too. While there no such thing as a sure thing, this is a fairly positive sign of more upside on the way.
Like the NASDAQ though, at this point we'd prefer to see the 50-day line at 1488 surpassed . Not only would that get the index back above a potential barrier, it would also place it back inside that generally bullish trading zone (framed by dashed red lines). By default, that would also mean we're starting to see higher highs AND higher lows.
S&P 500 Chart - Daily

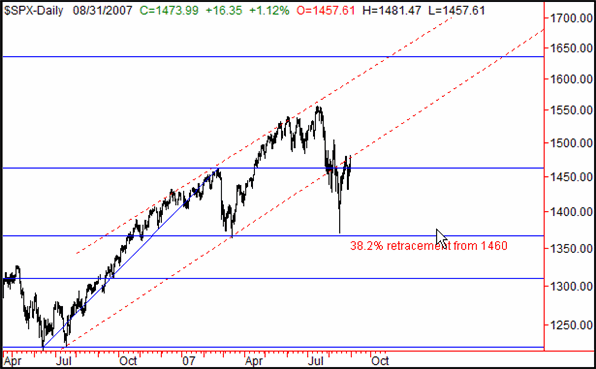
And just how far might the index move if this potential bullishness turns into the real thing? Let's again use some Fibonacci extension lines.
We've re-drawn the bullish zone again in red, and re-added one of the two possible Fibonacci lines in blue. (Notice how the key 38.2% retracement was brushed twice - we think this set of Fib lines is the right one to watch, even though March's rebound carried the index past that high of 1460.)
The upper edge of the bullish channel is rising, while the next Fibonacci level is at 1635. While it would have to be a rapid move to do it, we could see the index reaching that Fib line at about the same time it intercepts the upper edge of the bullish channel. That would be late October when and if it happened.
S&P 500 Chart - Daily, with Fibonacci lines

But can the S&P 500 really move 162 points in just two months? Yes, it's possible, but a definite stretch....especially given that September is historically one of the worst months of the year. There's the rub. Either the bullish channel is an aggressive model, or the Fib line at 1635 isn't aggressive enough. Still though, there's a lot of time and room for upside movement before we have to figure that out.
Bottom Line
Despite our generally bullish slant here, don't dismiss that last point we made - September is typically unkind to the market. Then again, August was excessively and unusually unkind to stocks, so there's the potential to buck the trend. Just be aware - we're still not free and clear of all the potential bearish pitfalls (like the moving averages we discussed above). If the coming week goes reasonably well, then we'll be past most of them.
Price Headley is the founder and chief analyst of BigTrends.com.
|