Today we're going to take a bit of a detour from our usual focus on technical trends, and devote some time to an often-overlooked reality. This will be an important TrendWatch to both traders as well as fundamental investors, as we explore why picking the right sector is just as important as picking the right stock.
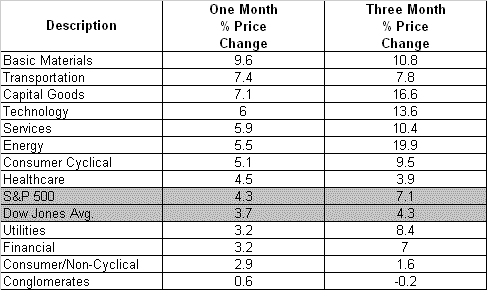
While the overall market has been rallying nicely over the last few days, if you have a truly diversified portfolio, you'll have noticed a few weak spots. Odds are that your tech stocks have done very well, but you were probably even more surprised to see how well your basic materials stocks did, such as International Paper (IP), Alcoa (AA), and Phelps-Dodge (PD) just to name a few. In fact, the materials sector helped to lead the charge with a one month return of 9.6%, second only to the transportation stocks.
On the other hand, you may be lamenting financials and the non-cyclicals. Their one month return has only been about 3 percent - half of what the leading sectors did. Neither even kept pace with the S&P 500.
Each sector's current performance is ranked in the chart below, descending from the best to the worst performing sectors over the last month. Performances over other time periods are listed as well, but we want to focus in on the stocks and sectors that have emerged as leaders in this most recent recovery.
Sector Performance Ranking - One Month

But what does this mean to you? While there are always exceptions, it is estimated that 20% to 50% of a stock's price movement is related to its sector and/or industry movement. In other words, while your capital goods (industrial) stock may be a strengthening company, those shares owe a big chunk of their recent gain to just being in the right sector or industry at the right time.
But it gets even more detailed than that. Sub-sector or industry weakness can drag a stock down (or up) too. Take the utilites for instance. Electric and natural gas utilities are mired in the same mediocrity. However, the water utilities have overcome the broad sector weakness. By how, much? The water companies are up an average of 8.4% for the month, leaving the other utilities in the dust. Skewed by a leader? Nope. The very worst-performing water company over the last month (Connecticut Water: CTWS) still gained 4.7%, so clearly there's a group trend there, or something more than an individual stock skewing the bigger-picture results.
The bottom line is simple: buy strong stocks in strong sectors, and avoid stocks in weak sectors. That's why we created the performance table you see above. This data is telling you where the real strength is developing, and where it's not. If you're able to, narrow that focus down to the specific industry. You may also want to compare earnings and revenue growth rates. Or to put it another way, don't go against the grain. You can see where the strength or weakness has been in the chart above, but I encourage you to keep abreast of each sector's performance, as it will most certainly change as time passes. You can bet that your individual stocks are probably doing about as well as their sector is.
Price Headley is the founder and chief analyst of BigTrends.com.