| Insurers Finally Buckle |
| By Price Headley |
Published
09/7/2007
|
Stocks
|
Unrated
|
|
|
|
Insurers Finally Buckle
After three years of being one of the most reliably bullish industries in terms of stock performance, the insurers are finally paying their dues. In fact, their respective charts may have taken more damage than they can overcome for the time being....especially the life and property/casualty insurers.
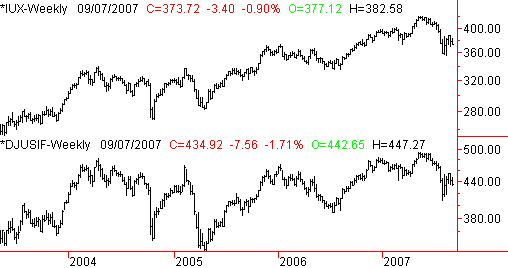
It's actually a little strange to be honest....the S&P Insurance Index (IUX) as well as the Dow Jones Full Line Insurance Index (DJUSIF) don't look the same as the life and property insurance indices. The broad S&P Index - which includes health insurance along with casualty and property - looks incredibly erratic....almost unpredictable. So, we're not necessarily referring to the insurance industry as a whole. Take a look at the S&P as well as the broad Dow indices here...you'll see what we mean.
S&P Insurance Index (IUX), Dow Jones Full Line Insurance Index (DJUSIF) - Weekly

Pretty indecisive, huh? You could almost make a bullish case based on the range-bound pattern we've seen for years. Yet, the Dow Jones Life Insurance Index (DJUSIL) and the Dow Jones Property and Casualty Index (DJUSIP) both seem to be moving with some consistency - for better or worse. In the current case, it's worse.
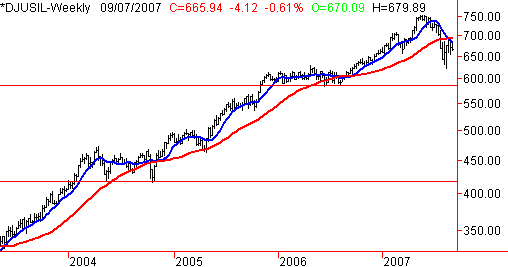
Let's start with the Dow Jones Life Insurance Index (DJUSIL). In late July it fell under its 200 day line (red) for the first time since mid-2006. Since then, it's continued slide even further under that long-term average. It's also been the biggest loss (drawdown) since 2002. Moreover, it appears the 50 day line (blue) is now acting as resistance.
Dow Jones Life Insurance Index (DJUSIL) - Weekly

As for where it might end we see two prior bases. The first one is at 589, where the index finally ended a flat period in 2006. That's about 11% under where we are now...a reasonable target. If that line fails to support the index, we wouldn't be shocked to see a retest of the base around 419. That's not a likely scenario, though stranger things have happened.
Major Life Insurers: AXA (AXA), Prudential (PUK), and Manulife (MFC).
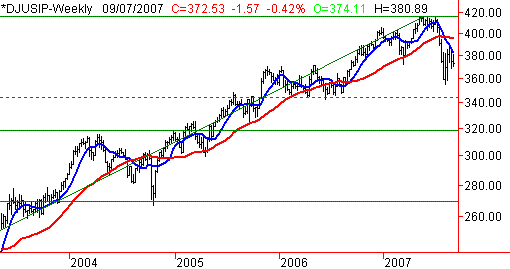
And what about the property and casualty insurance stocks? Dow Jones Property and Casualty Index (DJUSIP) chart pretty much looks like the life insurance chart. So, we're not going to rehash it. The only things to point out are the potential landing spots. Like the life insurance index, we see a base around 2006's lows of 344 (red, dashed).
We've added Fibonacci retracement lines (green) to this chart too. The baseline starts all the way back at 206 (not shown), where the index hit bottom twice...first in 2001, and then again in 2003. Those lines are drawn at 318 and 269. The former is possible the latter is a long shot.
Dow Jones Property and Casualty Index (DJUSIP) - Weekly

Major Property Insurers: Berkshire Hathaway (BRK-A), A.merican International Group (AIG), Allstate (ALL), and Travelers (TRV)
Price Headley is the founder and chief analyst of BigTrends.com.
|