|
Weekly Outlook in the Stock Market
Dramamine anyone? What a roller coaster ride! Just when it looked like the bulls might get their act together, we go and get a day like Friday. All of the weekly gains were wiped away, and some key technical support lines were breached.
The irony is that what caused the selling, terrible jobs data, almost ensures a rate cut or maybe even two. Ultimately, we think the market will prefer that over the alternative, despite what happened Friday. So yeah, we remain mostly bullish, though we're not buying like crazy either. We want to see whether Friday was a fluke or something more. Only this coming week will really say which is which, so we're now watching like a hawk Here's what we're looking for:
NASDAQ Composite
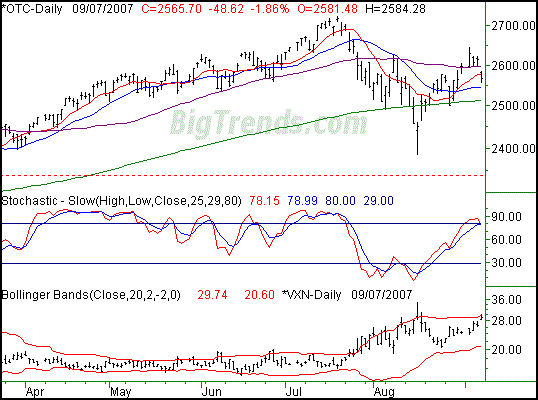
On Friday, the NASDAQ fell by 48.62 points, a 1.86% slide that left it at 2565.7. For the week, that meant a 1.18% loss as we closed 30.68 points under last week's close. Not only did the NASDAQ tumble back under the 50-day line, but also the 10-day average line (red).
We admit we're surprised to some extent. We've learned never to 'expect' anything with any certainty, but after three solid days of trading above the 50-day line (purple), we figured the market was in the clear. In fact, the 50-day line acted as a floor for the three days before Friday. Then WHAM!
You could make the argument that, being stochastically overbought, we were due. However, that idea doesn't hold a lot of water over a larger timeframe. Look back to April, May, June, and July. We were stochastically overbought in the short term as well as the long term then, but kept right on tracking, even with a few short-lived sell signals.
So now what? We're still generally bullish. Go back to the comments we were making between August 16 and 21. We saw some once-in-a-decade things there with volume and advancers/decliners. Those signals are still intact. Unless the 200-day line (green) at 2513 is breached, we plan on remaining bullish in the intermediate-term timeframe.
But what about between now and then? Friday rattled a lot of folks, no doubt about it. We may hear echoes of that for a few days. Until the composite gets back above the 50-day line at 2596, we can't really encourage reckless buying. It's a small thing, but important. If and when we get back above it, we'll talk about upside targets.
By the way, the VXN is in an interesting position, too. Its upper band was met on Friday. More often than not this has been a ceiling, suggesting the VIX is ready to roll lower while stocks move higher. However, check out what happened in July; the VXN just kept pushing that upper and upward. We have no call here yet, but a move lower for the VIX here might go far in confirming a bullish hint from the market.
NASDAQ Composite Daily Chart

S&P 500
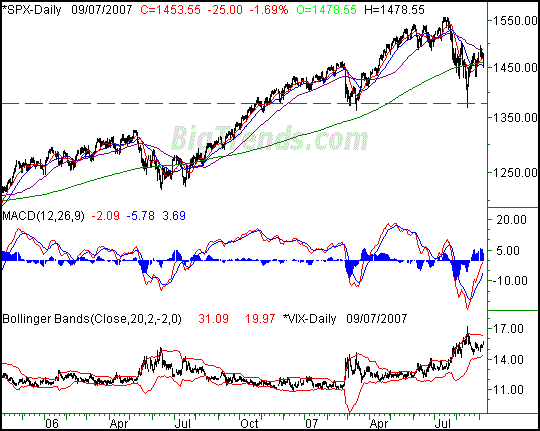
Friday's close of 1453.55 for the S&P 500 was the result of a 25-point loss (-1.69%). On a weekly basis, the large cap index fell back by 20.45 points, or 1.39%. Somewhat like the NASDAQ, the SPX broke back under technical support. The difference here is that the SPX never really got cleanly past resistance.
Specifically, we're talking about the 50-day line (purple), which we use as an intermediate-term indicator line. It was never crossed over. In fact, it almost looks like it was resistance, causing the poor week last week. The end result was a close under all the key averages, including the 200-day line (green). That's not encouraging to the bulls.
You'll notice that we really zoomed out on this week's daily chart of the S&P 500, going back to late 2005. The reason we did this was just to provide some perspective on where we are, with particular interest in the 200-day average and the MACD lines.
In a nutshell, there are short-term ebbs and flows, intermediate ebbs and flows, and long-term ebbs and flows. The short-term one is bearish as of yesterday, while the intermediate-term one is still in question. The long-term one, however, has a ton of upside potential left to play out.
The recent visit to the 200-day line was the first since this time last year. Before that, we danced with the 200-day line in October of 2005. These bullish MACD crosses that occur when the MACD lines are under zero, for indices anyway, are usually strong buy signals as well. Point being, it's not a very common occurrence. In a bull market, which we're still in, these usually present outstanding entry opportunities for multi-month positions, even if the short-term stuff remains a little hairy.
In any case, in the short run 1487 is the bullish make-or-break line. The SPX is already under all of the key moving averages...barely. If it again closes under them early in the coming week, that may be enough to open the flood gates enough to send the index all the way back to 1373. That's where the index found support on two distinct pullbacks.
S&P 500 Daily Chart

Dow Jones Industrial Average
The Dow fell a hefty 250 points on Friday, a 1.87% selloff. The close of 13,113 was 25 points below (-1.69%) the previous week's close.
Pretty much everything we said about the S&P 500 applies to the Dow. It pushed off the August 16 low pretty well, but hasn't really impressed us yet. The 50-day line seems to be a ceiling here as well.
Price Headley is the founder and chief analyst of BigTrends.com.
|