Mentor Graphics (MENT) has a well-defined bullish flag formation.
Reviewing the charts this weekend after a refreshing break, I was struck by how the dynamics of accumulation/distribution have changed since mid August. Notwithstanding the broadly based sell off that took place in the wake of Friday's surprisingly weak employment data, many stocks are showing clear evidence of more positive volume characteristics. Having said that the real clues as to institutional appetites for amassing more long exposure will come in the next few weeks as we see a seasonal increase in overall volume levels.
Another prominent characteristic that is noticeable on many charts and is exemplified in the daily chart for the S&P 500 below is the evidence of developing triangular or pennant formations where the alternation of upward sessions with downward sessions appears to be moving towars a critical apex. From a temporal point of view it would seem that these triangles suggest that the market is awaiting a clear indication of the underlying conflict between the ongoing problems in the credit markets and evidence of slowing economic activity but as a counterpoint the assumption that the Fed is gearing up for a possible 50 basis point ease at the meeting next week.
Overseas markets appear not to have sold off aggressively in the wake of Friday's US data. Although the Nikkei 225 followed the US indices down by about two percent other Asian markets made gains and in Europe the indices appear to have digested most of the impact of the employment report in Friday's trading.
If the Fed deliver as expected we may not get the outcome that traders desire which is a clear way forward out of the suspicions that have now become entrenched that all is not so benign in the world of asset backed financial engineering.
The S&P 500 came to rest at the 200-day EMA and I suspect that this key moving average may act as a powerful attractor in coming sessions whichever way the market happens to zig or zag in the very near term. 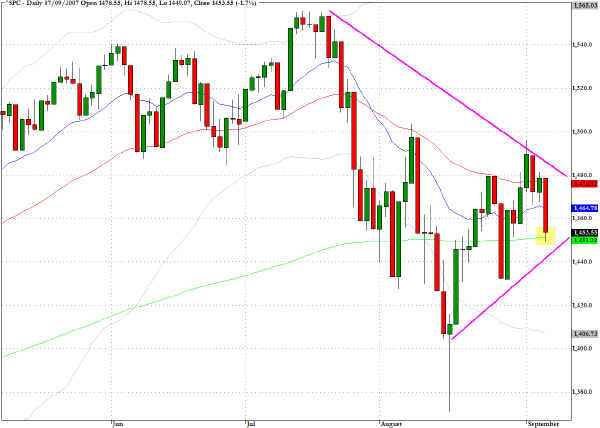
Before leaving for a vacation, I commented that the Russell 2000 (^RUT) faced a strong hurdle in mounting the 800 level which is also very close to the convergence of both the 50- and 200-day EMA's. This level continues to define a key challenge for the bulls that see the slowdown as an opportunity for stimulative lower rates rather than presaging more troubles for the financial economy. 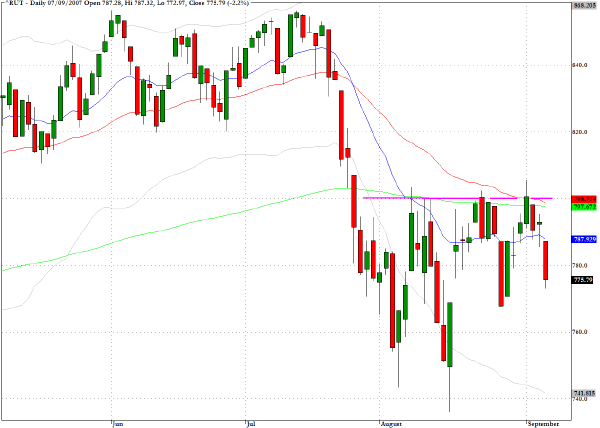
The Nasdaq Composite (^IXIC) still has the most constructive looking chart as it has clearly broken loose of the 200-day EMA. The move down on Friday brought the index back from its flirtation with the chart resistance levels that exist in the vicinity of 2630-40. 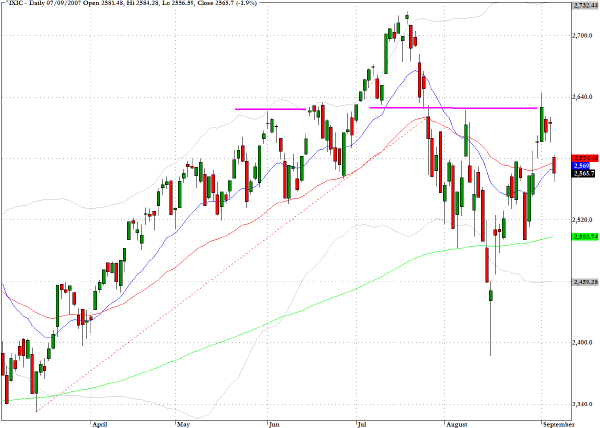
On June 13, the 10-year Treasury note hit an intraday high in yield terms of 5.32% and in Friday's trading we closed almost 100 basis points lower. This chart acts as a powerful reminder of just how dramatically the interest rate outlook has changed during the last three months.
The longer term weekly chart highlights the double top in yields but also points to the fact that yields have returned to a level close to 4.4% which may present an intermediate term floor. 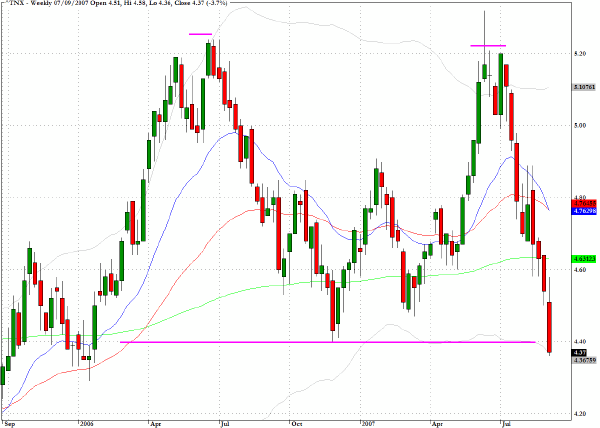
The chart for Xilinx (XLNX) illustrates a rising wedge formation, which is reliably bullish, but the stock has to take on the convergence of all three moving averages. 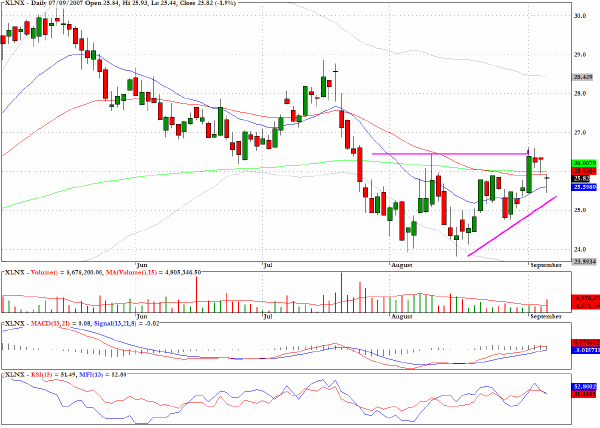
Mentor Graphics (MENT) has a well-defined bullish flag formation. 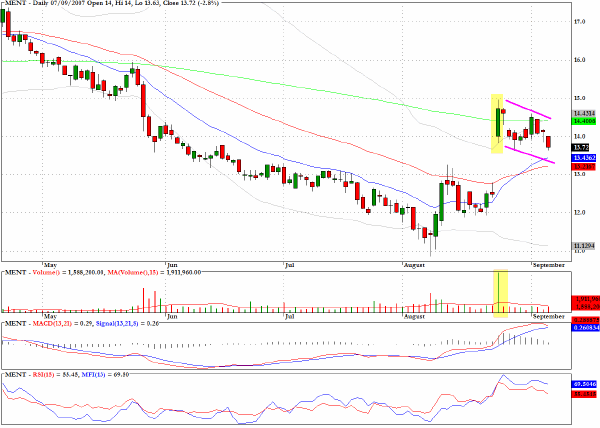
F5 Networks (FFIV) continues to exhibit the characteristics of an extended bear flag formation and the volume has been notably subdued since the large red candlesticks that occured in early August. 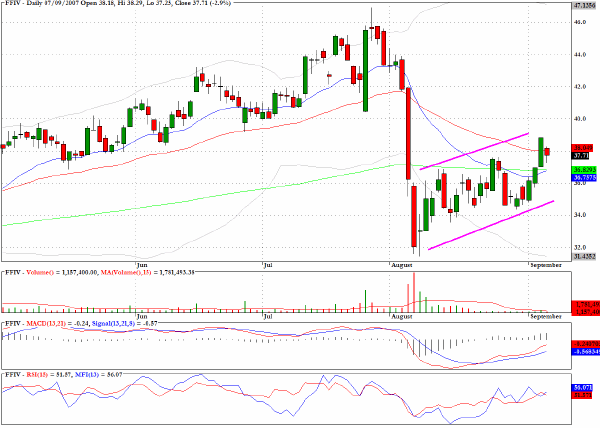
Johnson and Johnson (JNJ) shows a rising wedge pattern as it has moved along steadily upwards on a slope that has brought it to a confontation with the 200-day EMA. 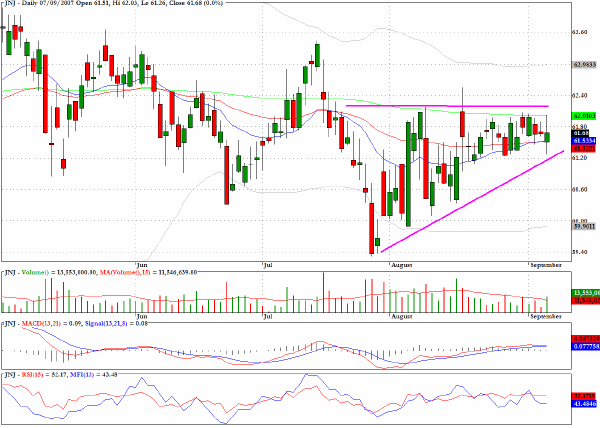
Clive Corcoran is the publisher of TradeWithForm.com, which provides daily analysis and commentary on the US stock market. He specializes in market neutral investing and and is currently working on a book about the benefits of trading with long/short strategies, which is scheduled for publication later this year.
Disclaimer
The purpose of this article is to offer you the chance to review the trading methodology, risk reduction strategies and portfolio construction techniques described at tradewithform.com. There is no guarantee that the trading strategies advocated will be profitable. Moreover, there is a risk that following these strategies will lead to loss of capital. Past results are no guarantee of future results. Trading stocks and CFD's can yield large rewards, but also has large potential risks. Trading with leverage can be especially risky. You should be fully aware of the risks of trading in the capital markets. You are strongly advised not to trade with capital.