| Corcoran Technical Trading Patterns for September 12 |
| By Clive Corcoran |
Published
09/12/2007
|
Stocks
|
Unrated
|
|
|
|
Corcoran Technical Trading Patterns for September 12
The market’s current predilection for abrupt alternations of strong downdrafts and rallies continued yesterday as the US indices put in a striking upward trend day. The S&P 500 opened on its low for the session and moved up throughout the day, registering a gain of 1.4%, to close at 1471. The 50-day EMA sits just above at 1475 and this should present both a target and obstacle in today’s trading.
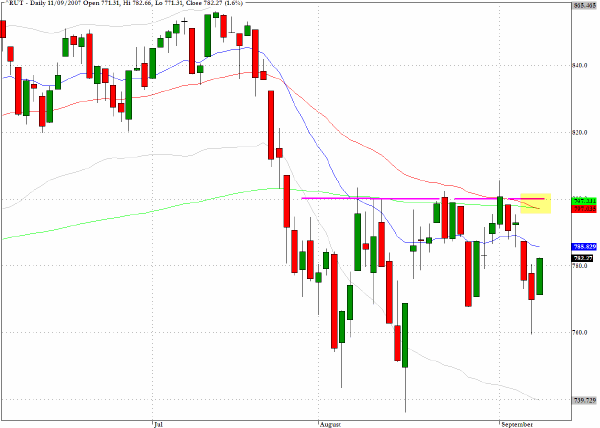
The chart below for the Russell 2000 (^RUT) well illustrates the characteristics of a trend day and the essential trading condition for these types of days is the temporary absence of the market’s normal fractiousness. It is as if there is a temporary consensus in which opinions regarding direction become remarkably unified and coherent. There is a consequent loss of liquidity as almost all market participants want to be on the same side of the market at once. The trading session was marked by relatively low volume which also suggests that we could easily see another trend day in the opposite direction in coming days, especially as the market nervously awaits the FOMC decision next week.
As previously mentioned, the bulls face a real challenge in sustaining closes above the 800 level.
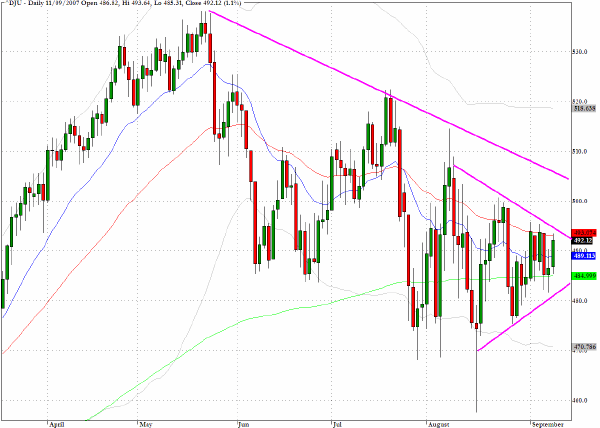
I have talked about triangular formations being very conspicuous on many charts at the moment, and the chart for the Dow Jones Utilities (^DJU) provides an excellent example of this. The triangles are nested and the shorter term formation is pointing towards a critical tension that should be resolved soon with a directional breakout. Given the decline in long-term Treasury yields, the odds would appear to favor an upward move as the dividends paid out by stocks in the sector will become more attractive to asset managers.
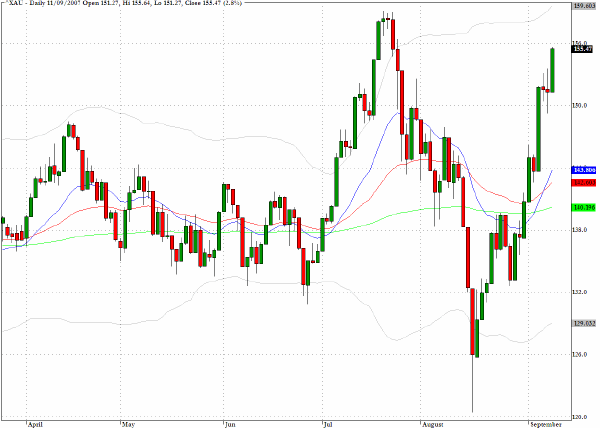
Gold is on the move and the metal has moved up by more than $30 during last week on the most actively traded COMEX contract. The chart for the gold and silver index (^XAU) which represents numerous mining stocks shows a remarkable formation.
The strong rebound in the index from the lows registered in mid August suggests that the stocks were being liquidated indiscriminately by major funds along with most other sectors of the market, and that there may have been a re-appraisal of the metal’s role as a monetary asset.
The dollar’s ongoing decline and the uncertainties that continue to beset the commercial paper market appear to have tipped the balance for momentum players in favor of an attempt to break decisively above the $730 level for the metal. The gold mining sector is relatively small and the stocks are playing catch-up with the metal, but if the dollar’s decline is not checked we could see much higher prices for the mining stocks and the metal in the months ahead.
In terms of assessing the potential longevity of the rally, it will be very instructive to monitor the metal’s behavior as it approaches $730 and the money flow dynamics of some of the principal gold mining stocks such as Newmont Mining (NEM).
TRADE OPPORTUNITIES/SETUPS FOR WEDNESDAY SEPTEMBER 12, 2007
The patterns identified below should be considered as indicative of eventual price direction in forthcoming trading sessions. None of these setups should be seen as specifically opportune for the current trading session.
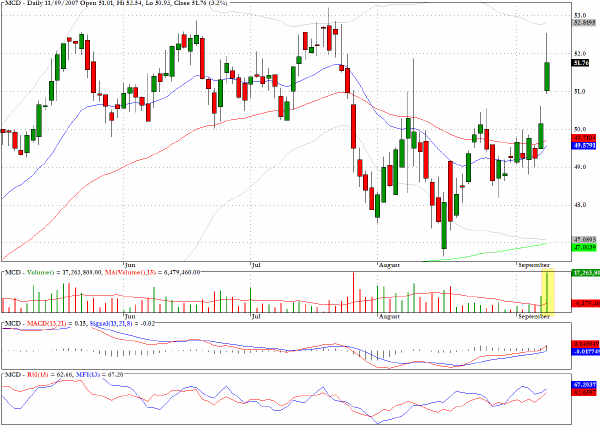
In yesterday’s commentary MacDonald’s (MCD) was cited as looking constructive from a money flow point of view with a rising wedge pattern that appeared to be pointing to a potential break above the recent congestion around the $50 level. The good news is that the stock performed almost exactly as expected, the bad news was that the stock gapped on the open reducing the attractiveness of the entry opportunities somewhat.
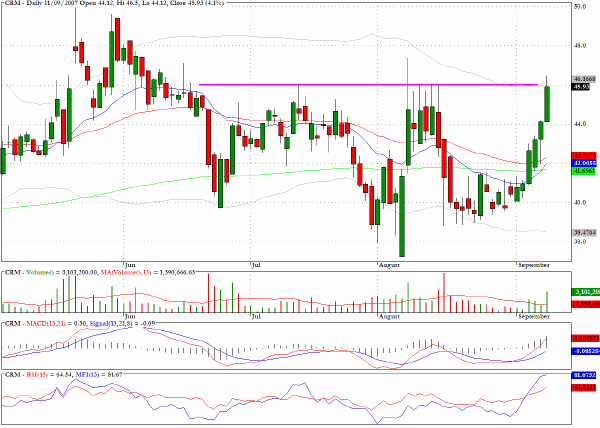
Also mentioned yesterday salesforce.com (CRM) moved as expected to the $46 level for a four percent gain but this time without the gap open. The stock now faces clear chart resistance.
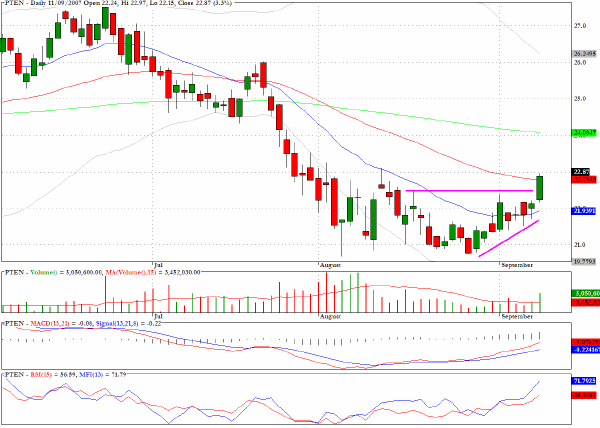
The chart for Patterson Energy (PTEN) reveals a promising looking breakout pattern in the context of an extended basing pattern.
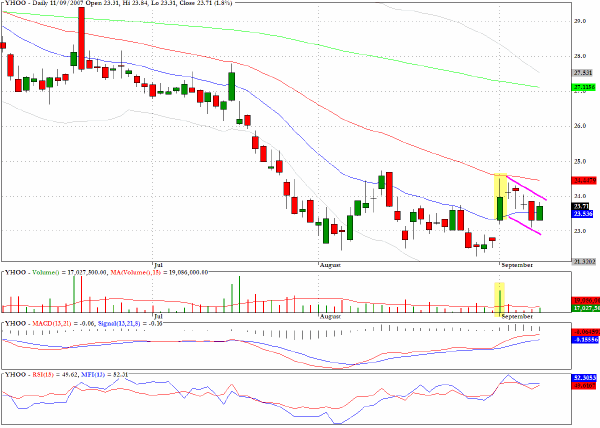
Yahoo (YHOO) has a small bull flag formation and there may be another upward spike to match that recorded on September 4th on heavy volume.
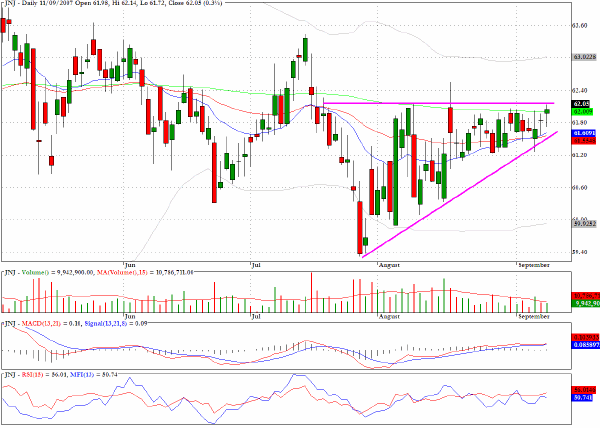
Just another mention for Johnson and Johnson (JNJ) which shows a rising wedge pattern as it has moved along steadily upwards on a slope that has brought it to a confrontation with the 200 day EMA.
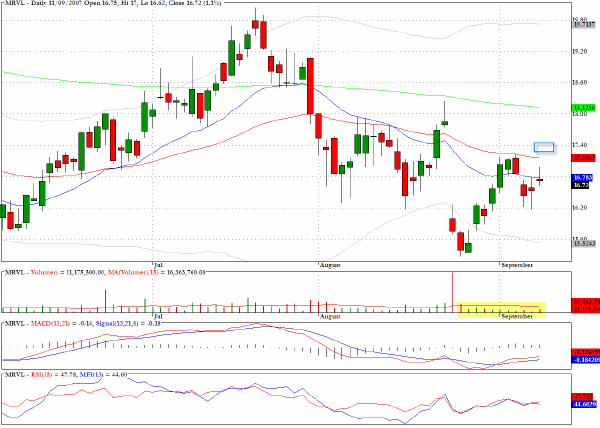
Marvell Technology (MRVL) looks vulnerable in the intermediate term to renewed selling but further upward movement towards the $18 level is likely in the near term.
Clive Corcoran is the publisher of TradeWithForm.com, which provides daily analysis and commentary on the US stock market. He specializes in market neutral investing and and is currently working on a book about the benefits of trading with long/short strategies, which is scheduled for publication later this year.
Disclaimer
The purpose of this article is to offer you the chance to review the trading methodology, risk reduction strategies and portfolio construction techniques described at tradewithform.com. There is no guarantee that the trading strategies advocated will be profitable. Moreover, there is a risk that following these strategies will lead to loss of capital. Past results are no guarantee of future results. Trading stocks and CFD's can yield large rewards, but also has large potential risks. Trading with leverage can be especially risky. You should be fully aware of the risks of trading in the capital markets. You are strongly advised not to trade with capital.
|