|
Sector Spotlight Update
We've put a lot of irons in the fire over the last few weeks, so rather than add anything new to the mix, today we're going to catch up on some previous sector commentary. Let's just start with the most recent and work our way back.
Insurance
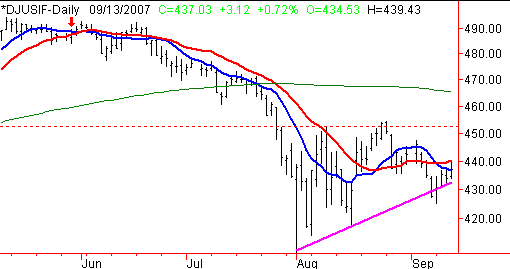
We first mentioned insurer's woes back on May 30. At the time, the Dow Jones Full Line Insurance Index (DJUSIF) had just produced a major rally, but was fading back from the peak near 494. We were guessing the chart would fall back to the 200-day line (green), then at 459. Well, it did that, and more.
Since then, things have gone from bad to worse. That's why mentioned them again last week. The index is back under its 10- and 20-day lines, and well under the 200-day average.
At this point, we expect this chart to move even lower, but we also see a short-term support line in place (pink). It's at 432 and rising. If it's breached, then look out below. Our new ceiling is at 452.
Dow Jones Full Line Insurance Index (DJUSIF) - Daily

Water
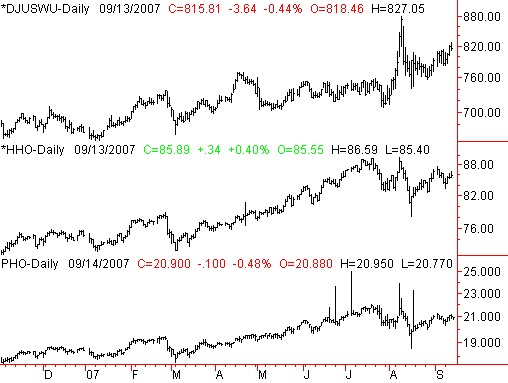
We re-mentioned on August 30 how water and related stocks looked enticing again. It was actually a theme we've been following off and on for a couple of years now. In just the last two weeks, we've seen the Dow Jones Water Index (DJUSWU) move 3.0% higher. That's not huge, but it sure beats the market's return of 1.7% since then.
Of course, we turned our attention to the more functional and tradeable ISE Water Index (HHO) and the PowerShares Water ETF (PHO). Both have been quite erratic since then, yielding a net return of the market's average.
Nevertheless, our opinions on water stocks still stand. This seems to be an outstanding longer-term, and even intermediate-term, opportunity. The left-to-right rise is clear, even if erratic. We didn't set specific targets for any of these charts. Instead, we advised just watching for a potential top.
Dow Jones Water Index (DJUSWU), ISE Water Index (HHO), PowerShares Water ETF (PHO) - Daily

Telecom
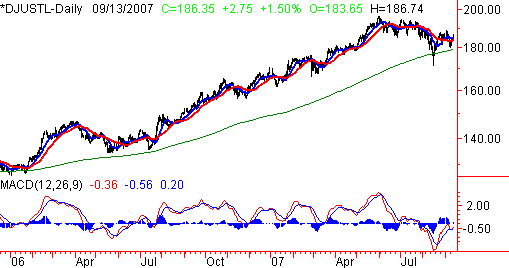
This is another one of those arenas we've been focusing on a lot over the last few months, but we renewed that focus on July 20. As of then, the Dow Jones Telecom Index (DJUSTL) had pulled back from 196 to 190. At the time, we were counting on the 50-day line to hold up as support, as it had from many months before that. Well, it did not, but what ended up happening may have been even better.
Instead, telecom followed the rest of the market lower, a trip that culminated with August 16's blowout. The telecom index hit a low of 171.40 that day, getting under the 200-day line by enough to call it a capitulation. It's been on the mend ever since, up 5.6% from the close on the 16th. The S&P 500, for comparison, is only up 5.0% since then. Yes, we know that's close to being a tie, but it's only been a month.
Currently at 186.35, now may be a more advantageous entry point than 190 was. And more importantly, we can now add some targets and stops to the opinion. Let's set a target of 222, and a stop of 180, where the 200-day line is now.
Dow Jones Telecom Index (DJUSTL) - Daily

REITs
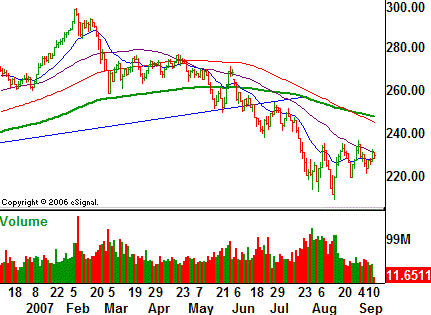
This look goes all the way back to May 2, when we first pointed out that the Dow Jones RREIT Index (RCI) looked like it was setting up a bearish head-and-shoulders pattern. At the time, the index was trading at 266.82. By August 15, the index made a close of 211.9, not a bad 8% move.
We initially thought even more downside was on the way, but now we're not so sure. Since that bottom was made, we've been seeing some consolidation - and slightly higher ranges. Though the 50-day appears to be acting as resistance, at this point, were inclined to suggest the downtrend is over for the time being. Any open REIT-based trades (in either direction) may now pose too much risk for not enough reward.
That being said, we still think this hot-spot could turn attractive again relatively quickly, though we're not sure if it will be bullish or bearish. We just know it's a big mover. If the 50-day line is breached that could spark a rally. If the index falls under the recent low of 209, the next wave of selling could kick in. We'll discuss any targets and stops if-and-when.
Dow Jones REIT Index (RCI) - Daily

Price Headley is the founder and chief analyst of BigTrends.com.
|